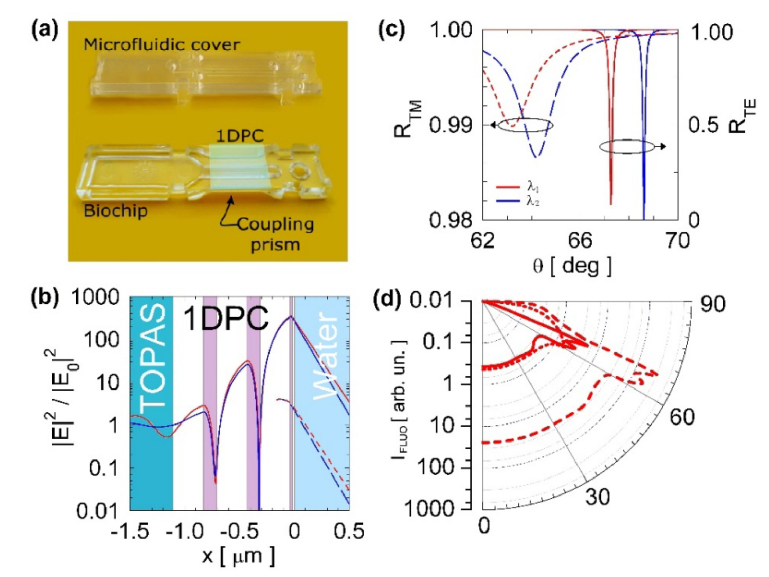
Fig. 1.
(a) Picture of the plastic biochip with integrated micro-optics and polymeric microfluidic cover, the deposited PC appears as a greenish square. (b) Normalized |E|2 field distribution in log scale associated to a resonantly excited TE BSW (solid) compared to the substrate/water interface (dashed). The curves are calculated at λ1 = 670 nm (red) and λ2 = 635 nm (blue). The 1DPC structure is shown in the background of the figure. (c) Angular reflectance spectra for the TE (solid) and TM (dashed) polarization, calculated at λ1 (red) and λ2 (blue). (d) Angular emission patterns in log scale integrated over the DyLight 650 spectrum and over the two TE and TM polarizations. The curves are for molecules isotropically oriented and located at the interface between: (dot) substrate/external medium, (solid) 1DPC/external medium, (dashed) 1DPC/external medium and taking into account the effect of the intensity enhancement on the excitation rate.

