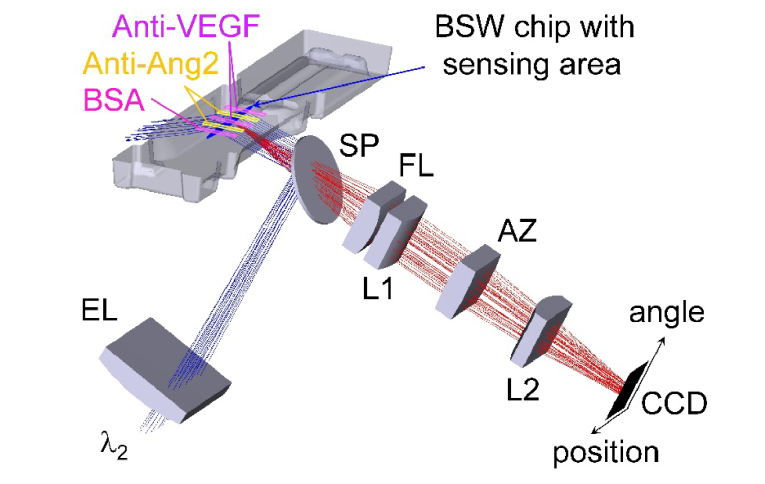
Fig. 2.
Sketch of the fluorescence mode optical system without plotting laser diode collimation. Fluorescence excitation (blue) and emission (red) are shown with an arrangement of five spots along the illuminated line. The positive (Anti-Ang2) and negative regions (Anti-VEGF and BSA) were obtained with the five-channel functionalization flow cell on top of the biochip. The two axes of the CCD detector represent the position along the illuminated line on the chip as well as the angular spectrum of emission.

