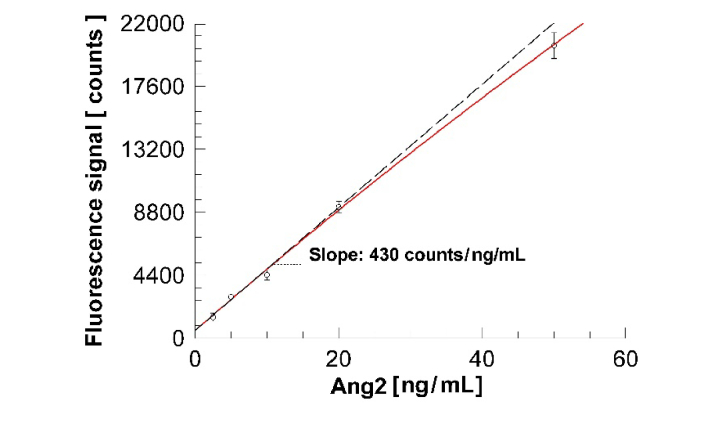
Fig. 6.
Calibration curve of Ang2 in D-PBS. Each point represents the difference between the averaged intensities recorded in the Anti-Ang2 spots and in the reference spots averaged on two replicate measurements. The coefficient of variation (CV) of the data points is 18%, 6.5%, 7.3%, 4.5%, 4.4%, from the lowest to the highest concentration respectively.

