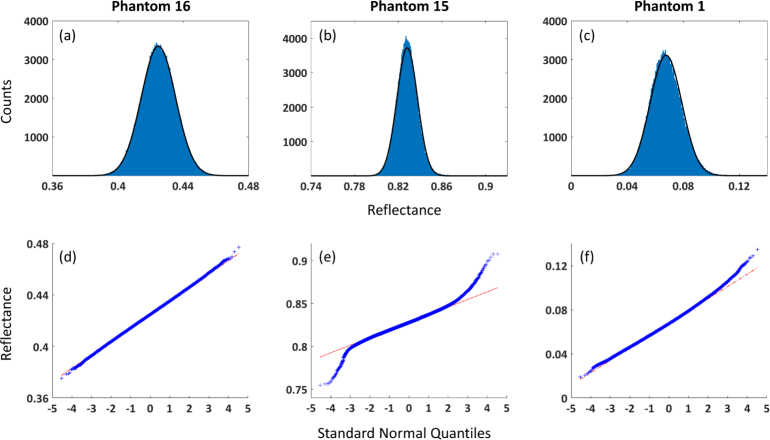
Fig. 2.
(a)–(c) Histogram and (d)–(f) quantile-quantile plots for ROIs of 3 phantoms (1 per column). See Appendix A for phantom optical properties. Data shown is for the following spectral wavelengths and spatial frequencies: Phantom 16: 851 nm, 0.05 mm−1; Phantom 15: 659 nm, 0 mm−1; Phantom 1: 691 nm, 0.2 mm−1. Black trace on histograms represents Gaussian distribution with mean and standard deviation calculated from data. Red line on quantile-quantile plots represents response of data with Gaussian distribution.

