Fig. 5.
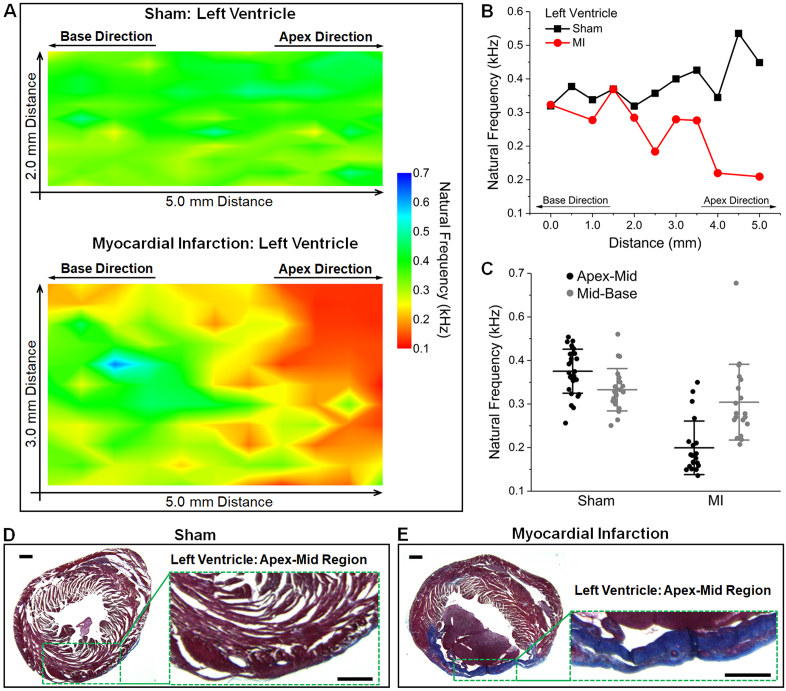
Mapping of natural frequency from OCE localized displacement damping analysis provides spatially resolved mechanical properties of MI. (A) Elastograms of the natural frequency cover the mid-ventricular region of representative sham and MI hearts. (B) Plots of selected natural frequency profiles from (A) shows the spatial dependent mechanical change in MI. (C) Comparison of natural frequency values from the hearts in (A). Corresponding histology of the (D) sham and (E) MI hearts in (A). Sections are from the apex-mid region with zoomed-in views of the left ventricular wall. Scale bars are 500 µm.

