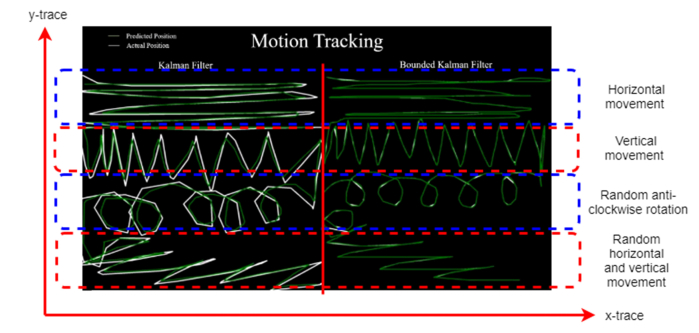
Fig. 9.
Figure explaining the x and y trace of a sample feature point from the ROIs during the specified movements (from top: Horizontal movement, Vertical movement, Random anti-clockwise rotation and Random horizontal and vertical movement). The actual and predicted position of the sample feature point is represented using a white and green colored line respectively.

