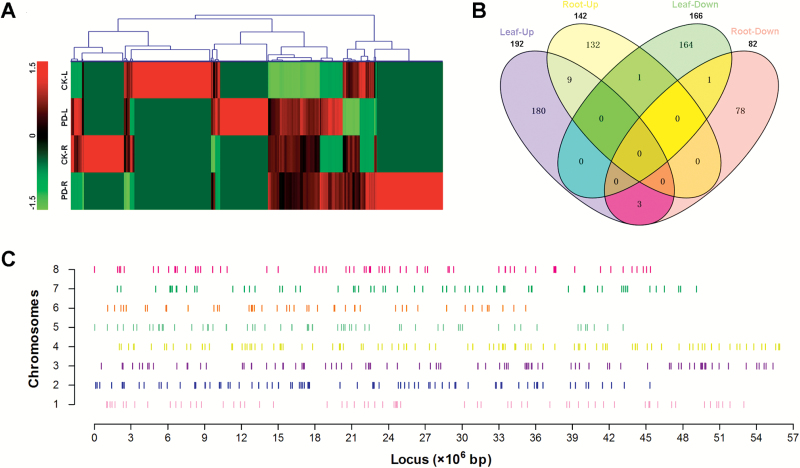
Fig. 2.
Heatmap (A), Venn diagram (B), and locus (C) of Pi-deficiency lncRNAs. The gene tree in (A) was drawn by the method of Hierarchical Clustering, and the Z-values of log2 FPKM were used in this analysis. CK, control (Pi-sufficient); PD, Pi-deficient; L, leaves; R, roots. In (C) the short vertical lines indicate the loci of Pi-deficiency lncRNAs in eight chromosomes.

