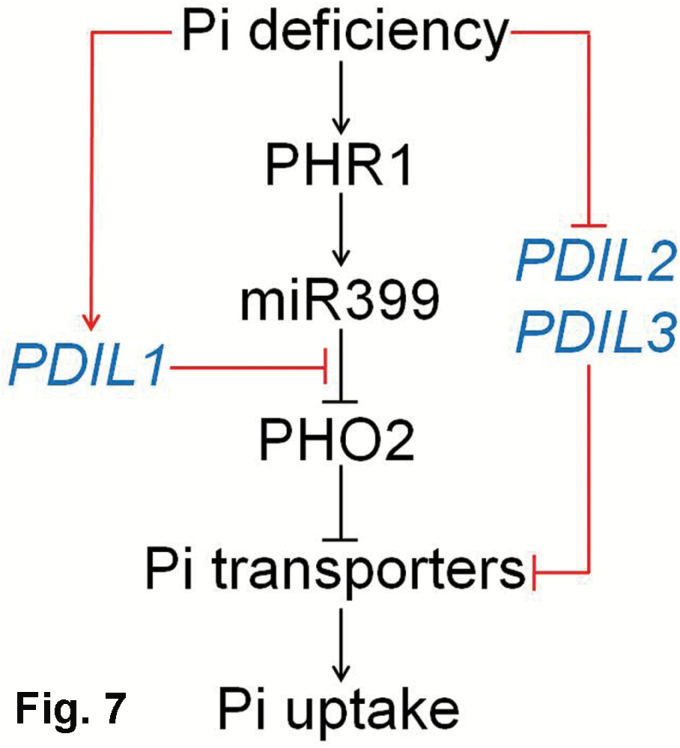
Fig. 7.
A model for Pi signaling involving PHR1, miR399, PHO2, and three Pi deficiency-responsive lncRNAs (PDIL1, PDIL2, and PDIL3) in M. truncatula. The red lines represent the pathways identified in the present study. Arrows denote positive effects, whereas lines ending with a short bar indicate negative effects.

