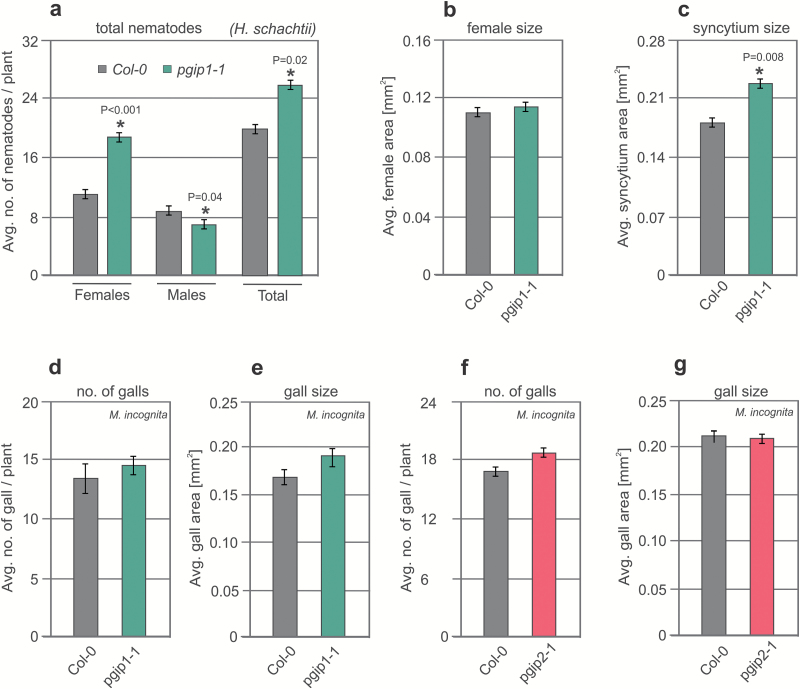
Fig. 3.
CN and RKN infection assays in PGIP1 and PGIP2 receptor mutant plants. (a) Average number of females and males per plant present in Col-0 pgip1-1 mutant lines at 12 dpi. (b, c) Average sizes of female nematodes (b) and plant syncytia (c) in Col-0 and pgip1-1 mutant lines at 14 dpi. (d, f) Average number of galls per plant present in Col-0, pgip1-1 (d), and pgip2-1 (f) mutant lines at 21 dpi. (e, g) Average area of galls per plant present in Col-0, pgip1-1 (e), and pgip2-1 (g) mutant lines at 21 dpi. (a–g) Bars represent the mean ± SE for three independent experiments. Data were analysed using t-test (P<0.05).

