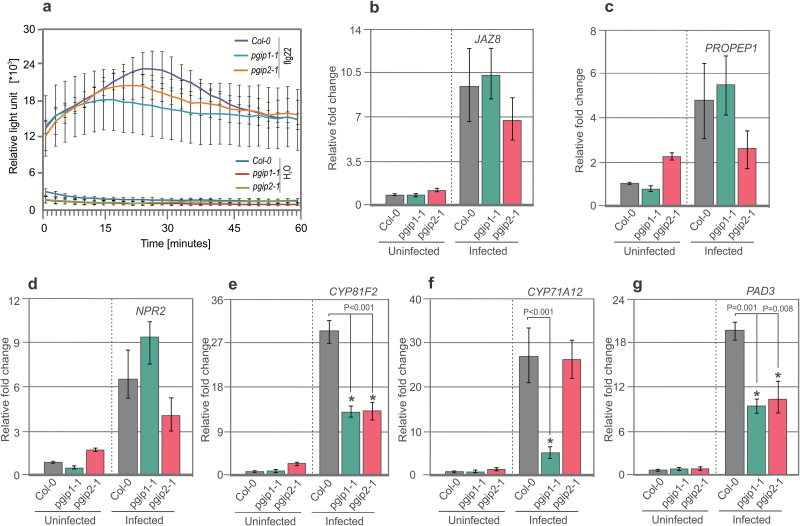
Fig. 5.
ROS production and gene expression analysis on root segments. (a) Root segments from Col-0, pgip1-1, and pgip2-1 plants were treated with water or flg22, and ROS burst was measured using an L-012-based assay from 0 to 60 min. (b–g) Infected and uninfected root segments (~0.2 cm) from Col-0, pgip1-1, and pgip2-1 plants were cut and gene expression was measured. For uninfected roots, data represent relative expression of the indicated genes with the value in Col-0 plants set to 1. For infected roots, data represent relative expression of the indicated genes with the value in uninfected roots set to 1. Bars represent the mean ±SE for three independent experiments. Data were analysed using Student’s t-test (P<0.05). Asterisks represent statistically significant difference from the corresponding Col-0.

