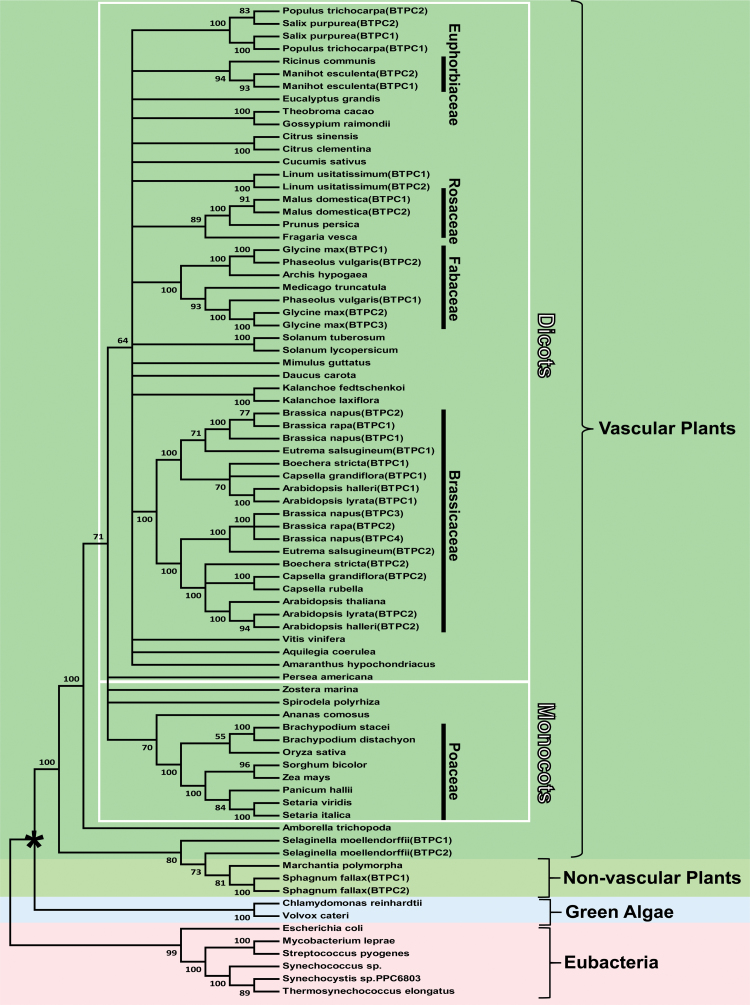
Fig. 1.
Phylogenetic analysis of plant BTPCs and several eubacterial PEPCs. The maximum likelihood tree was constructed using deduced amino acid sequences for the various PEPCs (gene identifiers available in Supplementary Table S1) from a muscle alignment conducted using MEGA7 (Kumar et al., 2016). Bootstrap analysis was carried out with 100 replicates and the numbers at the branch points correspond to percentage bootstrap frequencies. Bootstrap values less than 50 were collapsed. The tree was rooted using eubacterial PEPC as the outgroup. The asterisk denotes the divergence of plants from green algae. Gene identifier numbers for the various PEPCs are listed in Supplementary Dataset S1.

