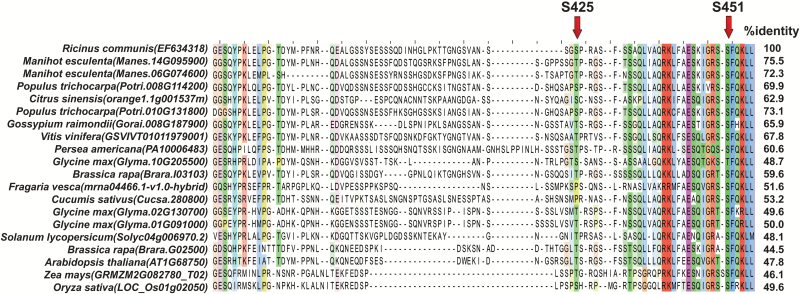
Fig. 2.
Alignment of the intrinsically disordered region of deduced plant BTPC polypeptides. The arrows indicate experimentally verified in vivo, inhibitory phosphorylation sites of COS BTPC, namely Ser-425 and Ser-451 (O’Leary et al., 2011c; Dalziel et al., 2012). Amino acid residues are colored according to their degree of conservation based upon Clustal×Color Scheme (http://www.jalview.org/help/html/colourSchemes/clustal.html).

