Fig. 3.
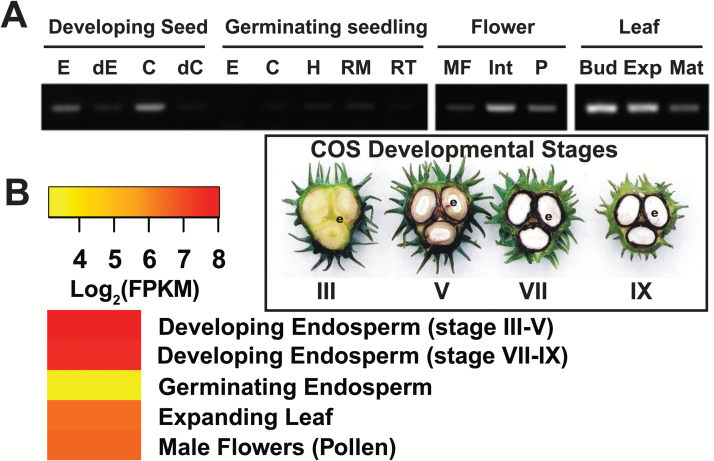
Correlation of castor BTPC expression. (A) Castor BTPC expression profiles as determined via RT-PCR (reproduced from O’Leary et al., 2011a. Tissue-specific expression and post-translational modifications of plant- and bacterial-type phosphoenolpyruvate carboxylase isozymes of the castor oil plant, Ricinus communis L. Journal of Experimental Botany 62, 5485–5495). E, endosperm; C, cotyledon; dC and dE, cotyledon and endosperm, respectively, from stage VII developing COS that had been depodded for 72 h; H, hypocotyl; RM, root middle; RT, root tip; MF, male flower; Int, integument; P, pericarp; Bud, leaf bud; Exp., expanding leaf; Mat., mature leaf. (B) Expression map (heat map) of castor BTPC expression derived from RNA-Seq data of Brown and co-workers (2012). Stages III, V, VII, and IX respectively correspond to the heart-shaped embryo, mid-cotyledon, full cotyledon, and maturation stages of COS development.

