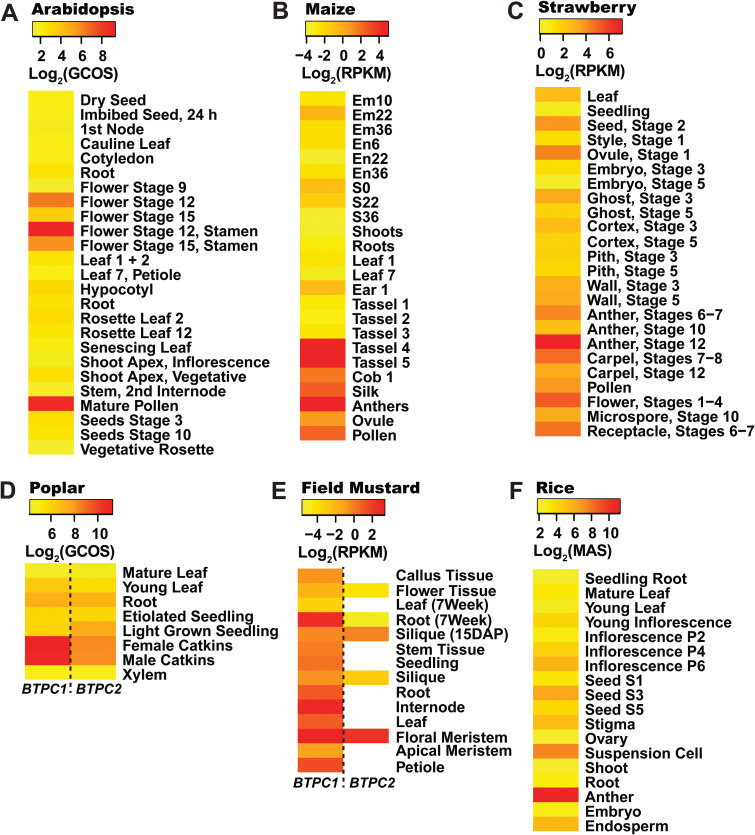
Fig. 4.
Expression maps (heat maps) of species that mainly exhibit pollen/floral-specific BTPC expression. The expression values for each species were Log2-transformed and scaled accordingly to contrast tissues within a particular species that exhibit the lowest and most abundant BTPC transcript levels. Empty (white) rectangles denote tissues with undetectable BTPC transcripts. Details of transcriptomic data are available in Supplementary Dataset S2. RMA, Robust Microarray Average values; GCOS, Normalized GeneChip Operating Software values; MAS, Normalized MAS 5.0 Software values.

