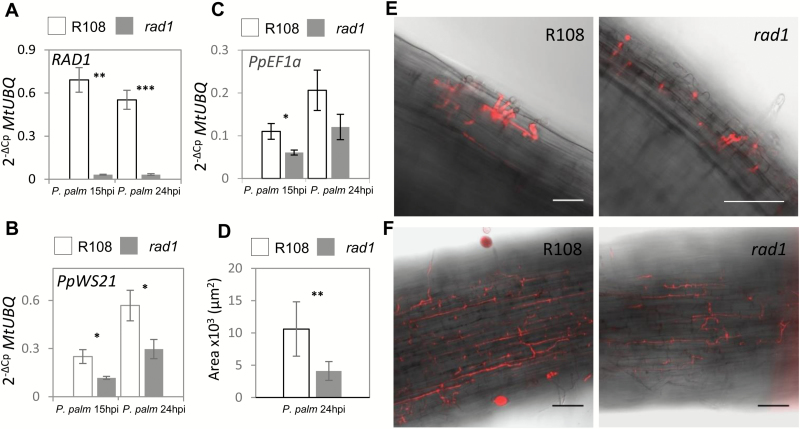
Fig. 5.
The M. truncatula rad1 mutant is impaired in colonization by P. palmivora. (A) Transcript levels of RAD1 in R108 (white bars) and rad1 (grey bars) upon infection with P. palmivora Lili-Td. (B) Transcript levels of PpEF1α in R108 (white bars) and rad1 (grey bars) upon infection with P. palmivora Lili-Td. (C) Transcript levels of PpWS21 in R108 (white bars) and rad1 (grey bars) upon infection with P. palmivora Lili-Td. For each data point, n=4 biological replicates were analysed. Student’s t-test was applied to compare gene expression between lines in each condition using MtUBQ as housekeeping gene and the 2−ΔCp method. (D) P. palmivora progress at 24 hpi in seedling roots of R108 (n=13) and rad1 (n=15) measured as surface area after binary conversion (Fiji) of confocal images. (E) Confocal microscopy of M. truncatula R108 and the rad1 mutant 5 hpi with P. palmivora Lili-Td. (F) Confocal microscopy of M. truncatula R108 and the rad1 mutant 24 hpi with P. palmivora Lili-Td.(*P<0.05; **P<0.01; ***P<0.001). Error bars show the SD. Scale bars=30 µm.

