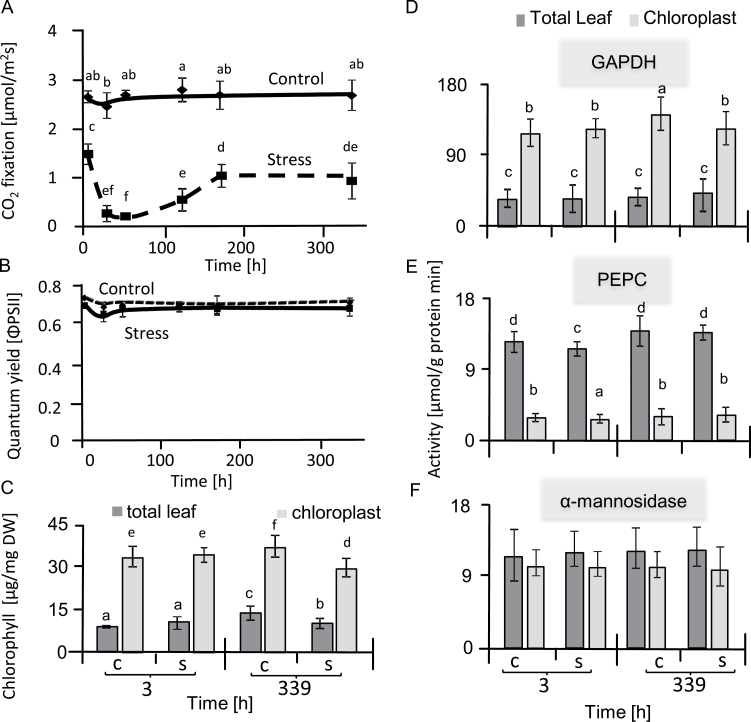
Fig 1.
State of photosynthesis and distribution of markers between the non-aqueous chloroplast fraction and the total sugar beet leaf. (A) CO2 fixation rates of the second and third leaf pairs were measured by infrared gas analysis, beginning when the salt stress was increased to its maximum level of 300 mM NaCl. Data are means ±SD of n=5 experiments. Different letters indicate significant differences as determined using Fisher’s LSD (P<0.05). (B) Quantum yield of photosystem II as measured with a pulse amplitude-modulated chlorophyll fluorescence analysis system in parallel with CO2 fixation. (C) Total chlorophyll contents. (D–F) Activities of NADP-glyceraldehyde-3-phosphate dehydrogenase (GAPDH) (D), phosphoenolpyruvate carboxylase (PEPC) (E), and α-mannosidase (F), in the non-aqueous chloroplast fraction and the total leaf sample of salt-stressed and control sugar beet. Data are means ±SD of n=6 experiments. Different letters indicate significant differences as determined using Fisher’s LSD (P<0.05). C, control; S, salinity.

