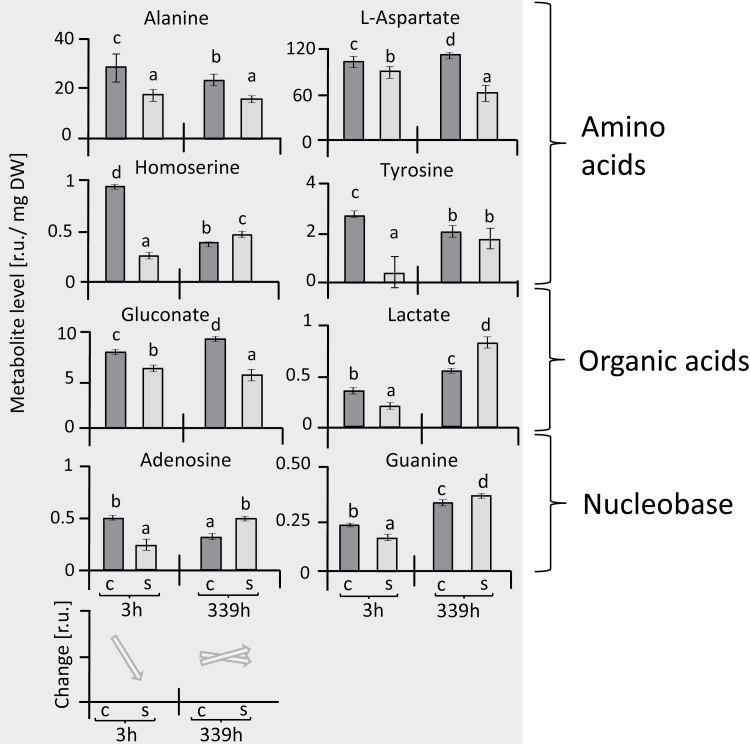
Fig. 5.
Changes in metabolites in leaves of sugar beet showing initial down-regulation under salinity stress. Metabolites are expressed in terms of relative units (r.u.), and the patterns of change are summarized at the bottom of the figure. Data are means ±SD of n=6 experiments. Different letters indicate significant differences as determined using Fisher’s LSD (P<0.05). C, control; S, salinity.

