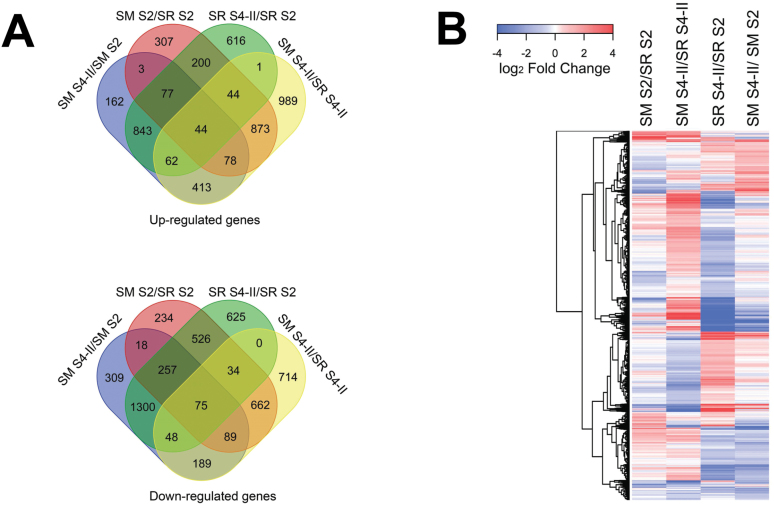
Fig. 2.
Venn diagram and heatmap analyses of RNASeq data obtained from Santa Rosa (SR) and Sweet Miriam (SM) cultivars at two developmental stages (S2, S4-II). (A) Venn diagram analyses of the 5,727 differentially expressed genes (DEGs), comparing the number of upregulated and downregulated genes within the same stage in different cultivars (SMS2/SRS2 and SMS4-II/SRS4-II) and within the same cultivar in different stages (SRS4-II/SRS2 and SMS4-II/SMS2). (B) Heatmap generated from the 5,727 DEGs from RNA-Seq analysis comparing fold changes in levels of gene expression within the same stage in different cultivars (SMS2/SRS2 and SMS4-II/SRS4-II) and within the same cultivar in different stages (SRS4-II/SRS2 and SMS4-II/SMS2). Heatmap colors represent gene expression fold change levels based on the provided color key scale; red for upregulated genes expression levels, blue for downregulated gene expression levels and white for no changes in gene expression levels.

