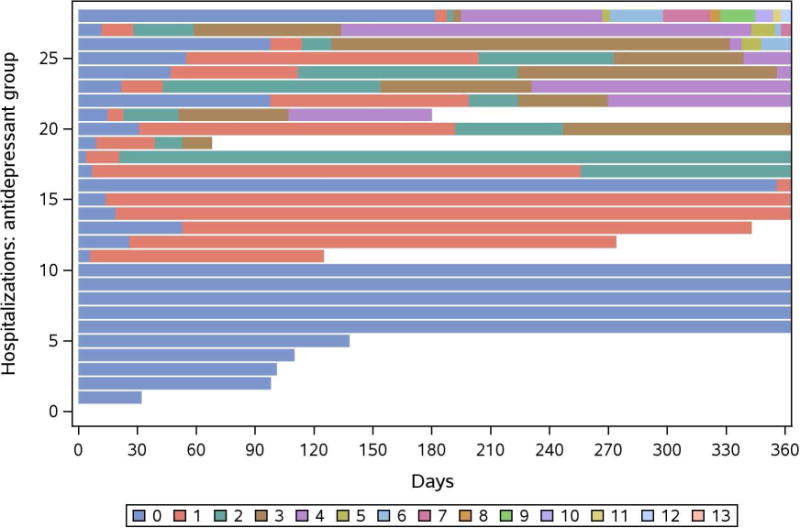
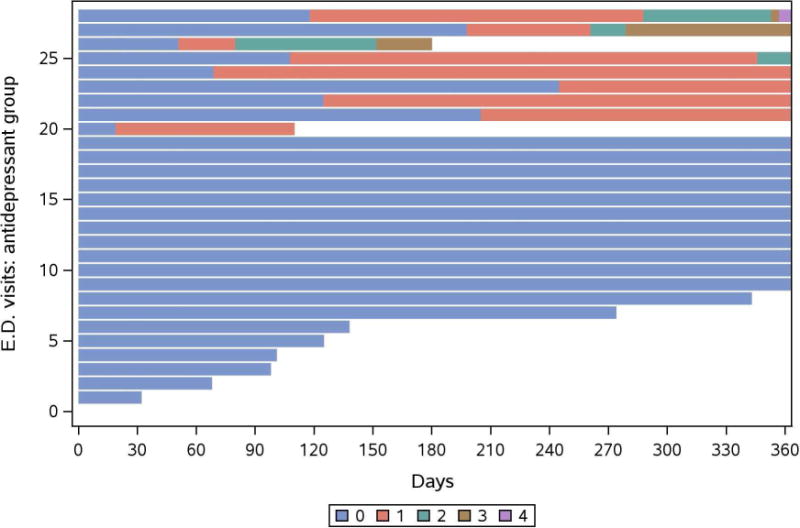
Figure 3.


a. Mosaic plot of hospitalizations within the first year after dialysis start in patients receiving antidepressant therapy at hemodialysis initiation. Units represent individual events per patient.
b. Mosaic plot of Emergency Department visits within the first year after dialysis start in patients receiving antidepressant therapy at hemodialysis initiation. Units represent individual events per patient.
