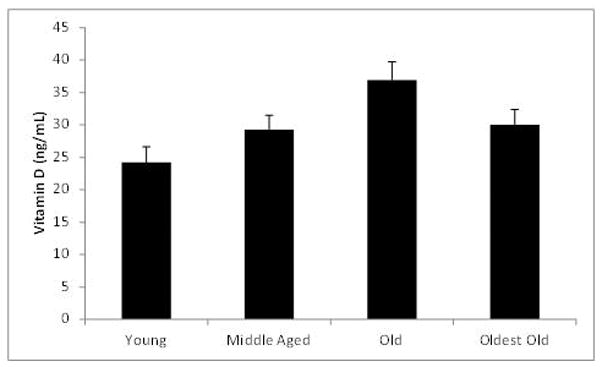
Figure 1.

Mean vitamin D levels for the four age groups after removal of outliers. The number of subjects in each group was: young (20–30 years) = 20, middle aged (50–65 years) = 20, old (66–80 years) = 20 and oldest old (81–95 years) = 19. Error bars represent standard error of the mean (SEM).
