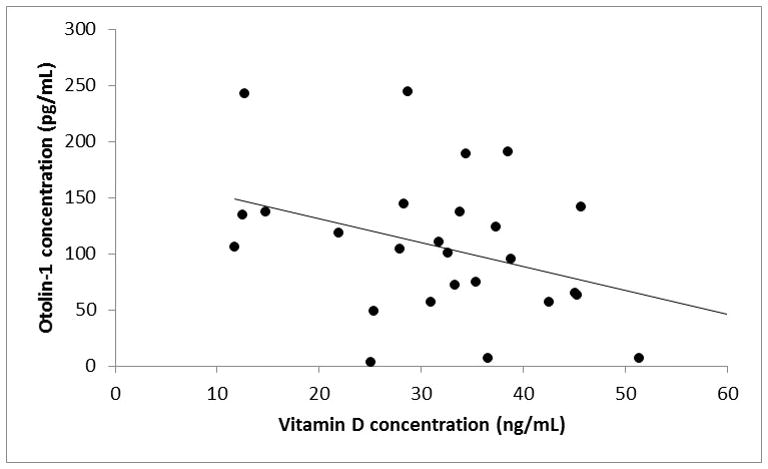
Figure 3.

Scatter plot of the relationship between vitamin D and otolin-1 levels in subjects 70 years of age and older. A linear trendline demonstrates graphically illustrates the relationship between the two variables. Subjects with otolin-1 levels > 350 ng/ml were determined to be statistical outliers are not represented in this figure.
