

Abstract
50 years ago, Vincent Allfrey and colleagues discovered that lymphocyte activation triggers massive acetylation of chromatin. However, the molecular mechanisms driving epigenetic accessibility are still unknown. We here show that stimulated lymphocytes decondense chromatin by three differentially-regulated steps. First, chromatin is repositioned away from the nuclear periphery in response to global acetylation. Second, histone nanodomain clusters decompact into mononucleosome fibers through a mechanism that requires Myc and continual energy input. Single-molecule imaging shows that this step lowers transcription factor residence time and non-specific collisions during sampling for DNA targets. Third, chromatin interactions shift from long-range to predominantly short-range, and CTCF-mediated loops and contact domains double in numbers. This architectural change facilitates cognate promoter-enhancer contacts and also requires Myc and continual ATP production. Our results thus define the nature and transcriptional impact of chromatin decondensation and reveal an unexpected role for Myc in the establishment of nuclear topology in mammalian cells.
Introduction
Cellular transitions during development are mostly driven by epigenetic and transcriptional changes of a selective group of genes. For instance, ex-vivo differentiation of stem cells into the three embryonic germ layers leads to repression of factors that maintain pluripotency, concomitant with upregulation of a selective group of lineage specific genes (Gifford et al., 2013). In like manner, myogenic terminal differentiation is initiated by epigenetic derepression and MyoD recruitment at genes that control the assembly of multinucleated myotube fibers (Caretti et al., 2004). By comparison, the terminal differentiation of B lymphocytes into plasma cells stands largely unique, in that while some de novo activation and repression of specific genes occurs, G0 B cells (also referred to as naïve, resting or quiescent) undergo a global and proportional amplification of their transcriptome as they enter the cell cycle (Kouzine et al., 2013; Loven et al., 2012; Nie et al., 2012). This process is driven by rapid engagement of RNA polymerases, which in G0 cells are recruited to most promoters transcribed during the immune response. Before cell cycle entry, PolII only displays basal activity partly because of limited expression of Myc and TFIIH. This feature renders promoter melting, PolII phosphorylation, and transition from abortive to productive elongation largely inefficient (Kouzine et al., 2013; Nie et al., 2012). During B cell activation, Myc and TFIIH expression levels are restored leading to a ∼10-fold increase in transcription within 24h.
The drastic transformation that characterizes lymphocyte activation was originally described in the 1960s and 70s, by exposing human lymphocytes to superantigens ex-vivo (Jaehning et al., 1975; Pogo et al., 1966). The reports documented an increase in cell size, RNA synthesis, and rapid proliferation. Furthermore, lymphocyte stimulation in the presence of 14C-labeled acetate led Allfrey and colleagues to uncover histone acetylation, which they described as accompanying the increase in gene expression (Pogo et al., 1966). More recent genomic and microscopy studies have corroborated the global increase in acetylation and chromatin rearrangements linked to lymphocyte stimulation (Kouzine et al., 2013; Rawlings et al., 2011). However, it is still unclear what cellular mechanisms drive these changes and precisely how they impact gene expression.
To this end we here applied genomics, nanoscopy, single-molecule tracking, and in situ Hi-C to monitor alterations in chromatin structure and architecture during B cell activation. The results reveal that as quiescent lymphocytes encounter antigens they rapidly decondense chromatin by spreading nucleosomes from the nuclear matrix to the entire nucleoplasm, decompacting chromatin clusters into mononucleosome fibers, and strengthening their nuclear architecture by creating new CTCF loops and contact domains. We show that chromatin spreading results from amplification of histone acetylation while decompaction and loop formation require Myc and constant energy input. Transcriptionally, these changes impact the dynamics of transcription factor binding and the tethering of gene regulatory elements. The data thus unravel the molecular pathways that control chromatin decondensation and nuclear topology in mammalian cells.
Results
Epigenome amplification is a general mechanism
First we sought to determine whether the epigenetic change observed by Allfrey and colleagues is limited to acetylation, or is part of a broader mechanism affecting other modifications. We therefore generated genome-wide maps of 34 chromatin modifications (17 acetylation marks, and 17 methylation marks, assayed by ChIP-Seq), the histone variant H2AZ (ChIP-Seq), and CpG methylation (whole genome bisulfite sequencing). B cells were either naïve (G0) or activated for 24h in the presence of LPS and IL-4. The analysis showed broad changes (>1.5 fold) for nearly 70% (24 of 36) of the modifications analyzed (Figure 1A). Of these, 22 corresponded to amplifications and impacted both acetylation and methylation of H2B, H3, and H4 (Figure 1A). Amplification was both global and proportional and it affected predominantly euchromatin (Figure S1A and S1B). The strongest change was observed for H4K16 acetylation, which increased 5.8-fold genome-wide (Figure 1A).
Figure 1. Extent and regulation of epigenome amplification during lymphocyte activation.
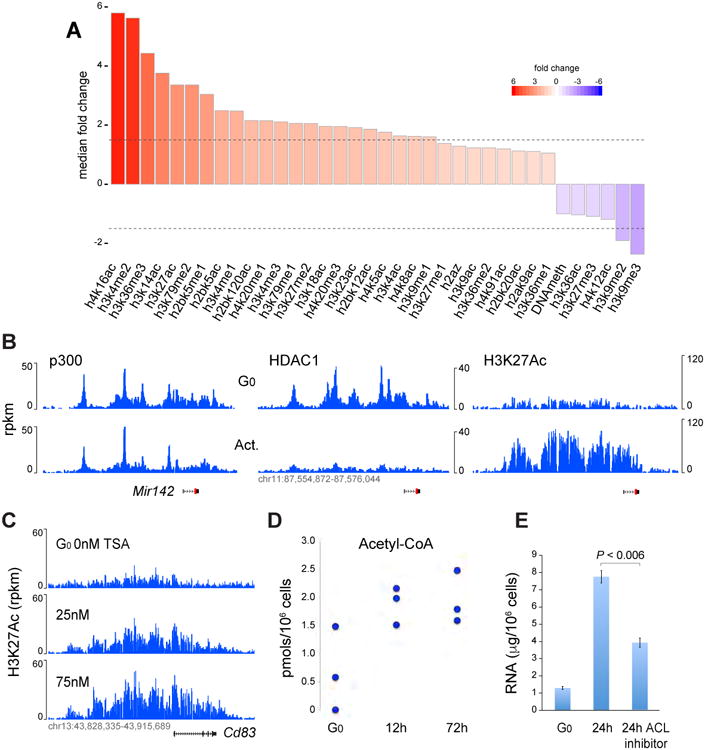
(A) Genome-wide fold changes in 34 epigenetic marks, including CpG methylation, between G0 and 24h activated B cell chromatin. Dotted lines represent +/- 1.5 fold change. (B) p300 (left), HDAC1 (middle), and H3K27Ac ChIP-Seq profiles at the Mir142 locus in resting and activated B cells. (C) H3K27Ac at Cd83 locus in resting B cells untreated (top track) or treated with increasing concentrations of TSA for 4h (lower tracks). (D) Acetyl-CoA production during B cell activation. Concentration is provided as pmols/106 cells and was normalized per cell size (see Methods). (E) RNA synthesis in G0 cells or 24h activated B cells in the presence or absence of the ACL inhibitor Medica16. Data are represented as mean +/- SEM.
By contrast, B cell stimulation led to pronounced downregulation (>1.5-fold) of only 2 epigenetic marks: H3K9me2 and H3K9me3 (Figures 1A), which are frequently associated with transcriptional repression. We also noticed a decrease in the inhibitory mark H3K27me3, which did not meet the 1.5-fold threshold (Figure 1A). Some modifications, as well as DNA demethylation, showed little or no change (Figure 1A and S1C). Thus, B cell activation triggers the amplification of acetylation and methylation marks, concomitant with a global repression of inhibitory marks.
Amplification of histone acetylation results from increased acetyl-CoA production and reduced deacetylation
Epigenome amplification could be due to increased bioavailability of chromatin modifying enzymes. However, the recruitment of acetyltransferases p300 and GCN5, as well as methyltransferases Mll1 or Wdr5 was largely unaffected during activation (Figure 1B left, and S2A-B). Likewise, the deacetylase HDAC2 was unchanged (Figure S2B). Conversely, HDAC1, which plays a key role in B cell activation (Yamaguchi et al., 2010), was abundant in G0 but dropped to nearly background levels by 24h (Figure 1B, middle and right).
To determine whether HDACs constrain global acetylation in G0, we treated naïve B cells for 6h with the general HDAC inhibitor Trichostatin A (TSA). This led to amplification of histone acetylation to levels comparable to those seen in activated cells. We obtained similar results when we treated with the HDAC1-specific inhibitors Tacedinaline and CAY10398. (Figure 1C and S2C). In fully activated B cells, where HDAC1 is already depleted, such inhibition had little effect (Figure S2D). Thus, the removal of acetyl residues by HDAC1, and possibly other HDACs, leads to dramatic reductions in overall acetylation levels in G0. Consequently, HDAC inhibition can recapitulate widespread acetylation even in the absence of activation.
In addition to HDACs, chromatin acetylation is regulated by ATP-citrate lyase (ACL) and the pyruvate dehydrogenase complex (PDC), which synthesize acetyl-CoA (Sutendra et al., 2014; Wellen et al., 2009). Western blotting showed increased levels of both enzymes during B cell activation (Figure S2E), and these profiles were accompanied by higher acetyl-CoA production, from an average of 0.08pmols to 0.23pmols/106 cells as early as 12h post-activation (Figure 1D). To probe the significance of this change, we cultured B cells in the presence of the ACL inhibitor Medica16. Relative to control, treated cells failed to blast and displayed a marked reduction in H3K27Ac and RNA synthesis (p < 0.006, Figure 1E and S2F).
Thus, despite the presence of preloaded acetyltransferases genome-wide, we find that G0 cells maintain low levels of acetylation via two mechanisms: [i] limited production of the required substrate acetyl-CoA, and [ii] constant deacetylation through the effects of HDAC1 and possibly other HDACs. This strategy may facilitate the global amplification of histone acetylation during activation through rapid synthesis of acetyl-CoA and removal of HDACs.
B cell activation induces global chromatin remodeling
Along with epigenetic marks, ATP-dependent remodeling of nucleosomes augments gene expression. To explore this activity, we mapped nucleosomes at high resolution (∼4 billion paired-end reads) with an improved version of MNase-Seq (see Methods). Consistent with previous work (Schones et al., 2008), transcription start sites (TSSs) of silent promoters were inaccessible both in G0 and activated B cells (Figure 2A, black lines), while nucleosomes at active promoters were depleted 5′ of TSSs and displayed nucleosome phasing starting at -1 and +1 dyads (Figure 2A, red lines). Notably, similar phasing and overall nucleosome depletion (1.5-fold lower) was observed at active enhancers (Figure 2B).
Figure 2. Global remodeling of chromatin during B cell activation.

(A) Nucleosome profiles at silent (black lines) and transcribed (red lines) promoters in G0 (left) and activated (right) B cells as determined by MNase-Seq. (B) Same analysis as in panel A for enhancer domains. Arrows in A and B indicate remodeling in activated B cells extending beyond regulatory elements. (C) Nucleosome remodeling across the mir155 locus. MNase-Seq signals from G0 samples were subtracted from those of activated counterparts. The schematics depict genes with black boxes and mir155 enhancers with red boxes. (D) Extent of nucleosome remodeling in heterochromatin and euchromatin compartments during B cell activation. (E) Chromatin occupancy of Chd4 and Brg1 in G0 and 24h activated B cells. Data are represented as mean +/- SEM.
We noticed that nucleosomes were depleted beyond promoters and enhancers in stimulated cells (Figure 2A-B, arrowheads), suggesting that remodeling complexes target broad genomic areas as lymphocytes enter the cell cycle. We explored this idea by analyzing MNase-Seq signals within the context of gene regulatory clusters (Kieffer-Kwon et al., 2013). As shown for the mir155 locus in Figure 2C, nucleosome depletion affected the entire mir155 regulatory cluster area, which comprised long-range interactions between the mir155 promoter and 5 transcribed enhancers upstream (Kieffer-Kwon et al., 2013). The myc locus provides another representative example (Figure S3A), and a composite analysis confirmed the widespread nature of this activity (Figure S3B).
A comparison between euchromatin and heterochromatin MNase signals showed that nucleosome depletion extends across both compartments following B cell activation, although the effect was substantially more pronounced in euchromatin (Figure 2D). Notably, these changes were not due to increased recruitment of remodeling enzymes. Chd4 and Brg1, the ATPase subunits of NuRD and SWI-SNF, showed little or no change in occupancy during activation (Figure 2E and S3C). Conversely, ATP levels increased nearly 2-fold as G0 cells entered the cell cycle (Figure S3D). We conclude that remodeling complexes are poised in G0 chromatin and that global nucleosome remodeling follows increased ATP synthesis.
Chromatin decondensation consists of spreading and decompaction of histone nanodomains
To visualize how decondensation impact nucleosome organization along the chromatin fiber we applied super-resolution microscopy (STORM), which provides down to ∼20nm spatial resolution of histones (Ricci et al., 2015). Analysis of H2B distribution in fixed samples revealed a marked relocation of chromatin following B cell stimulation. In G0, H2B was enriched in the nuclear periphery and relatively depleted at the nuclear center (p < 0.01, Figure 3A and S4A). Conversely, H2B was evenly spread in activated cells (Figure 3A and S4A). The spreading was evident 6h post-activation, reaching a maximum (80-90%) at 24h (Figure 3B and S4B).
Figure 3. Chromatin decondensation during B cell activation involves spreading and decompaction of nucleosome nanodomains.

(A) STORM images of H2B distribution in representative G0 and 24h activated B cells. Scale bars = 1μm. (B) Violin plot showing the nuclear area (percentage) occupied by H2B during B cell activation. Number of cells analyzed: 28 (0h), 29 (6h), 20 (24h). (C) Close up view of H2B signals in a B cell nucleus (left), its decompaction via STORM software (center), and a zoomed in section of the same image (right) showing nucleosome nanodomains, nanodomain centroids, and nearest neighbor distances. Crosses within nanodomains represent single molecule localizations. Scale bars = 500nm, and 50nm as indicated. (D) Bar graph shows localizations per nanodomains in resting (blue) and activated (red) B cells. Number of cells analyzed: 35 (G0) and 33 (activated). B and D data are represented as mean +/- SEM.
Following the method recently employed in human fibroblasts and ES cells (Ricci et al., 2015), we clustered B cell nucleosomes into discrete 2D nanodomains (Figure 3C). We found that these clusters changed considerably during B cell activation, shrinking in size from ∼800nm2 in G0 to 600nm2 at 24 hours (p = 5.6e-11, Figure S4C). This decrease was accompanied by a drop in nanodomain density, from 19 to 12 single-molecule localizations (p = 3.6e-11, Figure 3D). Based on a calibration curve of mono- and poly-nucleosome arrays (Figure S4D, (Ricci et al., 2015)), these values represent ∼4 and 1 nucleosomes per nanodomain in G0 and activated B cells respectively.
We next examined the results of STORM imaging using antibodies for H3K27ac (a mark enriched in euchromatin) and H3K9me2 (a mark frequently seen in heterochromatin). In both cases, we observed nanodomain spreading and decompaction following B cell activation, although to varying degrees (Figure S4E). These findings are consistent with the global reduction of nucleosome occupancy observed by MNase-Seq.
Amplification of histone acetylation triggers nanodomain spreading while decompaction requires Myc and continual energy input
In addition to follicular (B-2) cells, the peripheral B cell compartment is composed to B-1 and marginal zone (MZ) cells. In contrast to B-2, which do not require antigens for development or maintenance, MZ and B-1 lineages are positively selected by self-antigens. This continual priming enables population self-renewal, secretion of natural antibodies, and a more rapid response to invading pathogens (Hardy and Hayakawa, 2015). The semi-active state of B-1 and MZ cells correlates with levels of RNA synthesis and histone acetylation that are elevated relative to follicular G0 cells, but that do not reach the levels seen in activated B cells (Figure S4F-G).
STORM H2B analysis showed that chromatin in quiescent MZ and B-1 cells occupies ∼90% of the nuclear area (Figure 4A), a profile indistinguishable from that of activated follicular B cells (Figure 4B). The degree of decompaction in B-1 and MZ B cells was intermediate between G0 and activated counterparts (p < 6e-5, Figure 4C). These data are consistent with the view that elevated levels of acetylation lead to chromatin spreading.
Figure 4. Pathways that regulate chromatin decondensation.

(A) Representative distribution of chromatin (H2B) in G0 follicular (upper), B-1 (middle), and MZ (lower) B cells. (B-C) Box plots portraying the extent of nanodomain spreading and decompaction respectively in B cell subsets. G0 and activated B cell data reproduced from Figure 3. Cells analyzed: 28 and 35 (G0), 20 and 33 (activated), 21 and 30 (MZ), 20 and 34 (B-1). (D) H2B nanodomain spreading in controls samples and in the presence of TSA (left, G0), Medica16 (middle, 6h), and myc deficiency (right, 24h). Cells analyzed: 28 (G0), 11 (G0 TSA), 29 (6h control), 11 (6h Medica), 20 (24h control), 12 (24h myc-/-. (E) H2B nanodomain decompaction (single molecule localizations/nanodomain) in the presence of TSA, myc-/-, and oligomycin. G0 and activated B cell data reproduced from Figure 3. Cells analyzed: 35 (G0), 17 (G0 TSA), 33 (24h activated), 42 (24h activated myc-/-), and 7 (oligomycin). Data are represented as mean +/- SEM.
To directly determine whether acetylation causes spreading we exposed G0 cells to TSA, a treatment that amplifies acetylation in the absence of stimulation (Figure 1C). Notably, we observed TSA-induced spreading of non-activated G0 chromatin to ∼70% of the nuclear volume (p = 1e-3, Figure 4D), a profile that corresponds with the spreading of B cells activated for 6h (Figure 4D). In contrast, TSA treatment had no impact in nanodomain decompaction (p = 0.2, Figure 4E). Consistent with these results, inhibition of histone acetylation with Medica16 prevented the initial spreading of chromatin following activation (Figure 4D), whereas decompaction was unaffected (not shown). These data demonstrate that histone acetylation mediates chromatin spreading.
The myc oncogene plays a key role in B cell cycle entry (Lin et al., 2012; Nie et al., 2012). To test whether it is also involved in nucleosome decondensation we deleted myc in naïve B cells using mycflox/floxCreER mice (Figure S5A). Consistent with previous results (Nie et al., 2012), myc-deleted cells showed little blasting and failed to amplify RNA synthesis upon stimulation (Figure S5B). At the same time, H3K27Ac levels were comparable between KO and WT cells (Figure S5B), indicating that Myc is not required for histone acetylation during B cell activation. Consistent with the aforementioned-link between acetylation and chromatin spreading, STORM analysis revealed comparable nanodomain spreading in Myc-depleted and WT nuclei (p = 0.03, Figure 4D). Conversely, there was a significant defect in nanodomain decompaction in the absence of Myc (p = 2.4e-6, Figure 4E).
During lymphocyte activation Myc increases energy production in the form of ATP (Wang et al., 2011). To test whether continual energy production was required to keep chromatin decompacted, we acutely depleted ATP from stimulated B cells by oligomycin treatment. We found that while spreading was unchanged (Figure S5C), nanodomain decompaction was partially reversed (Figure 4E). Taken together these results show that chromatin spreading and decompaction are differentially regulated. Whereas the former is linked to histone acetylation, the latter requires the myc oncogene and continual energy input.
Nanodomain decompaction lowers transcription factor search time
Chromatin decondensation is thought to modulate transcription, at least in part, by increasing accessibility to transcription factor binding sites. To define the role of nanodomain spreading and decompaction in this process we turned to single-molecule tracking (SMT). Using CRISPR, we targeted the HaloTag to Jund and Ctcf genes in mouse zygotes. To avoid the embryonic lethality and protein instability observed with CTCF N terminus fusions (Heath, 2007), the HaloTag was introduced at CTCF C terminus. We found that both JunDHalo/Halo and CtcfHalo/Halo mice were born at Mendelian ratios from heterozygous breedings. We first followed the dynamics of JunD and CTCF during B cell activation using fast SMT (Abrahamsson et al., 2013). The technique allowed us to monitor single-molecule random collisions with chromatin in nine focal planes (4μm total depth), thus providing a 3D view of rapid binding and diffusion of transcription factors during DNA interrogation (Figure 5A and Movie S1).
Figure 5. Chromatin decondensation reduces target search time and residence time for transcription factors.

(A) Mice knockin for JunD- or CTCF-HaloTags were used to track single molecule dynamics. Volume rendering of three dimensional movement of JunD-HaloTag molecules (black dots) superimposed to single-molecule trajectories. For all SMT experiments the JF549 dye was used. (B) Bar graph shows the number of collisions (non-specific binding) at accessible chromatin sites in the different cell types and conditions indicated. (C) Micrographs depict 2D tracking at long exposure times of JunD-HaloTag molecules, which are visible as bright spots (stably bound) or diffusing signals (fast-moving). (D) FRAP analysis (data points) and model (lines) of CTCF-HaloTag in G0 (blue) and activated (red) B cells. (E) FRAP analysis of TSA treated G0 (grey), and myc-/- (green) or oligomycin (black) treated activated B cells. Number of cells analyzed 21 G0, 18 G0 + TSA, 18 aB, and 8 aB + oligomycin, 7 aB myc-/-. For all FRAP experiments the TMR dye was used. B, D, and E data are represented as mean +/- SEM.
The analysis showed that in G0 JunD collides ∼135 times before binding stably to chromatin, while in activated counterparts random collisions were reduced to less than half (61, p=8e-14, Figure 5B). This suggests that JunD samples on average 135 non-specific sites before engaging a specific target. Similarly, CTCF displayed a marked decrease in random collisions upon B cell stimulation, from 102 to 45 (p=2.2e-12, Figure S5D). To determine whether this change was mediated by chromatin decondensation we exposed G0 cells to TSA but found no difference (p=0.2, Figure 5B and S5D). Conversely, nanodomain compaction by Myc or ATP depletion reversed JunD and CTCF search time to G0 levels (p < 2e-7, Figure 5B and S5D). Thus, the decrease in transcription factor search time correlates with decompaction of nucleosome clusters rather than chromatin spreading.
To explore whether decompaction also impact transcription factor residence time, we analyzed JunD dynamics by 2D tracking using epi-illumination. Consistent with previous results with ES cell pluripotent factors (Chen et al., 2014b), JunD molecules formed bright diffraction-limited spots (Figure 5C and Movie S2). The distribution of dwell times times extracted from single-molecule tracks are best described by a two-component exponential decay model (Figure S5E) and are believed to represent transcription factor specific and non-specific binding (Chen et al., 2014b). In G0, the average residence time for the short-lived component was <1s, whereas for the long-lived it was 24s (Figure S5F). Notably, in activated B cells the long-lived component displayed a marked reduction in residence time to 9s (Wilcoxon p=2e-16, Figure S5F), while the short-lived component showed little or no change (not shown). Importantly, myc or ATP depletion reversed JunD residence time either partially or entirely (p=0.001 and 3e-12 respectively, Figure S5F), while TSA treatment did not.
We validated those results by computing CTCF residence time via fluorescence recovery after photobleaching (FRAP, (Nakahashi et al., 2013)), because, as described (Gebhardt et al., 2013), SMT did not provide accurate measurements of very long residence times (in minutes rather than seconds). CTCF signal recovery in G0 and activated cells was biphasic, with a rapid recovery phase followed by a slow component at ∼130 sec (Figure 5D). However, in G0 recovery was noticeably slower. Using standard principles of physical chemistry, various possible mechanistic theories were tested to fit the results. Only a model that included a very slow (“immobile”) binding state accounted for the data (Figure 5D and Methods). Similar to JunD long-lived component, the residence time of the immobile fraction dropped from 53 to 27 minutes post-activation (Figure S5G). Furthermore, like JunD, recovery of CTCF-HaloTag in activated B cells was affected by depletion of myc or ATP, while TSA treatment had no impact (Figure 5E). Thus, B cell activation modulates the dynamics of both fast and slow moving factors and this phenomenon correlates with conditions that increase the compaction of nucleosome clusters.
B cells gain thousands of loops and domains during activation
Finally, we applied in situ Hi-C to determine whether the changes in chromatin structure seen via STORM were associated with changes in the contact patterns at individual loci. G0, activated B cells, and for comparative purposes, ES cells were processed. From 47 libraries generated, we obtained a total of 3.7 billion contacts. Strikingly, long-range contacts were observed much more frequently in resting B cells (Figure 6A). This was reflected in curves of intra-chromosome contact probability In as a function of distance s, where the average scaling of In(s) in G0 displayed a more shallow decay than activated counterparts or ES cells at distances greater than 3Mb (Figure 6B). This is consistent with dilution Hi-C studies of human B cells, where telomere-centromere interactions decrease as naïve cells enter the germinal center reaction (Bunting et al., 2016). The high-resolution nature of in situ Hi-C however enabled us to monitor changes in chromatin loops and contact domains, key architectural features that cannot be resolved with low-resolution protocols (Figure S6A).
Figure 6. B cell activation doubles the number of loops and loop domains which facilitate the tethering of regulatory DNA.

(A) Hi-C contact matrices for chromosome 11 (1-29Mb close-up) in G0, activated B cells, and ES cells. Juicebox parameters were balanced normalized at 100Kb resolution with a color range of 150 (G0 and activated) or 75 (ES cells). (B) Hi-C contact probability as a function of distance (In(s)) in G0 (blue), activated B cells (red), or ES cells (black line). (C) Closeup view of a representative genomic locus that acquires loop domains during B cell activation (D) Venn diagram shows number of loops in G0 and activated B cells. (E) Aggregate peak analysis (APA) plots display the average Hi-C signal at chromatin loops that are shared or gained during activation. (F) ChIP-Seq profiles of CTCF and Rad21 from the genomic locus displayed in panel C. (G) Cumulative plot showing Rad21 levels (activated/G0) at anchors for loops that are common or that are induced during B cell activation. (H) Box plot shows mRNA fold change (activated/G0) at contact domains displaying low (left) or high (right) increase in intra-domain interactions (see Figure S7E). Data are represented as mean +/- SEM.
In contrast to long-range interactions, short-range contacts were increased post-B cell stimulation (Figure 6B and S6B). This was reflected by an increase in contact domains (3,783 vs. 5,775, Figure 6C) and CTCF-mediated loops (4,562 vs. 8,000, Figure 6D). Furthermore, loops present in both cell types (3,896) were strengthened during activation (Figure 6E). Thus, B cell differentiation promotes a nuclear architectural shift from long-range to predominantly short-range contacts leading to a near doubling of loops and topological domains. To validate this shift by an orthogonal method we applied high-throughput three-dimensional DNA FISH (Hakim et al., 2012; Shachar et al., 2015) to selected loci. Analysis of 16,670 cells corroborated both the increase in short-range contacts and the concomitant decrease in long-range contacts (Figure S6C).
Architectural loops require CTCF and cohesin binding at loop anchors (Dowen et al., 2014; Flavahan et al., 2016; Guo et al., 2015; Lupianez et al., 2015; Rao et al., 2014; Sanborn et al., 2015; Tang et al., 2015). ChIP-Seq analysis revealed an increase in cohesin (Rad21) at common and particularly at induced loop anchors (Figure 6F, 6G, and S6D). CTCF displayed a modest increase in binding at induced loops but little or no change at common ones (Figure S7A). Thus, the appearance of chromatin loops during B cell activation correlates primarily with increased recruitment of cohesin at loop anchors.
Loci displaying significant increases in intra-domain interactions were often associated with genes driving the B cell response, including myc (Figure S7B). We explored whether promoter-enhancer contacts at these loci are preferentially augmented. Of 1,176 gene clusters analyzed, contact frequency increased between most (92%) cognate promoter-enhancer pairs following activation (Figure S7C and Table S1). Notably, associations between non-regulatory DNA increased proportionally within the same topological domains (Figure S7C). Indeed, the ratio of regulatory vs. non-regulatory DNA contacts remained essentially the same during the stimulation period (Figure S7D). Thus, promoter-enhancer contacts augment during B cell activation but in general the increase is not preferential for regulatory DNA. To determine whether these changes impact transcription we classified topological domains based on contact gains and measured mRNA levels (Figure S7E). By and large, gene expression was higher at loop domains displaying the greatest increase in interaction frequency (Figure 6H). Thus, the shift from long-range to short-range contacts is accompanied by an increase in regulatory DNA interactions and gene expression.
The formation of architectural loops and domains requires Myc and continual energy input
Aside from architectural proteins, the cellular mechanisms that establish nuclear topology in mammalian cells are unknown. To explore whether the pathways that regulate chromatin decondensation play a role, we generated in situ Hi-C maps from G0 B cells treated with TSA, or activated B cells depleted of Myc or ATP. Replicate samples were processed for each condition and a total of 3.6 billion contacts were obtained.
Contact matrices showed that in TSA-treated G0 cells, despite the global amplification in acetylation, there was no change in long-range chromatin interactions (Figure 7A (compare to 6A)). By the same token, there were no changes in In(s) at ranges where intra-domain contacts are predominant post-activation (<3Mb, Figure S7F). Notably, the nuclear architecture of activated B cells was essentially reversed to that of G0 upon Myc or ATP depletion (Figure 7A and 7B). The average scaling of In(s) under both conditions was comparable to that of resting cells (Figure S7F). Consistent with these observations, loop contacts were markedly reduced in myc-/- and oligomycin-treated cells (Figure 7B and S7G). In general, these changes were accompanied by a reduction in Rad21 binding relative to activated cells, particularly at genomic sites where architectural loops were most affected (Figure 7C). Taken together, these observations demonstrate that the shift in nuclear topology that accompanies B cell activation is downstream of Myc and requires continual energy input.
Figure 7. Nuclear architecture in mammalian cells requires Myc and continual ATP production.
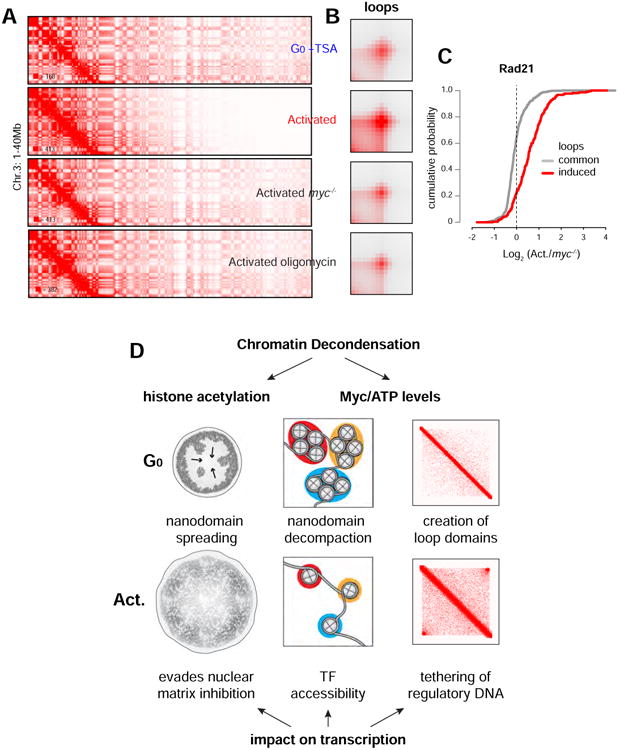
(A) Hi-C contact matrices for chromosome 3 (1-40Mb close-up) in G0 + TSA, activated B cells, activated myc-/- B cells, and activated B cells + oligomycin. (B) APA plots showing contacts at loops in the cell types described in panel A. (C) Cumulative plot showing Rad21 levels (activated activated/myc-/-) at anchors for loops that are common or that are induced during B cell activation. (D) Global chromatin decondensation during lymphocyte activation is mediated by histone acetylation and the Myc-ATP pathway. Acetylation enables the spreading of chromatin nanodomains from the nuclear membrane to the entire nucleoplasm, an activity that has been shown to evade the transcriptional inhibitory impact of the nuclear matrix. The Myc-ATP pathway on the other hand facilitates the decompaction of chromatin nanodomains into a mononucleosome fiber, which in turn imparts DNA target accessibility to transcription factors. Architecturally, Myc and continual energy input also mediate the creation of loops and loop domains by increasing cohesin recruitment. The resulting intra-domain interactions facilitate in turn transcription by augmenting the tethering of regulatory DNA.
Discussion
Naïve B cells are epigenetically primed for activation
B cells must carefully balance the need to respond rapidly to invading pathogens while avoiding unnecessary activation which can lead to autoimmunity. Key to this balance is the quiescent nature of the peripheral compartment, which is replenished daily with G0-arrested cells migrating from the bone marrow. In this metabolically inert state, the immunoglobulin receptor transmits “tonic” signals via PI3K, keeping B cells alive for several months (Srinivasan et al., 2009). Antigen recognition and T cell costimulation readily ends this latent state and enables cell cycle entry. The mechanisms driving this rapid activation have been unclear.
At the transcriptional level we previously showed that naïve lymphocytes recruit polymerases to most B cell promoters but restrict expression of Myc and TFIIH (Kouzine et al., 2013; Nie et al., 2012). Mitogenic signals stabilize both factors, leading to a ∼10-fold amplification of the transcriptome. In like manner, we now demonstrate that the epigenome undergoes a comparable amplification in acetylation, methylation, nucleosome remodeling, and in the number of architectural loops and domains. The common feature is that amplification in all cases is driven by activation of preloaded enzymes.
Histone acetylation is enhanced by a boost in acetyl-CoA production, HDAC1 depletion from chromatin, and likely an increased reliance on aerobic glycolysis as B cell activation proceeds (Blair et al., 2012). While the molecular basis for HDAC1 eviction is unclear, its inhibition alone is sufficient to initiate global histone acetylation in the absence of external stimuli or changes in cell size. Remarkably, S. cerevisiae relies on the HDAC1 homologue Rpd3 to mediate cell quiescence (McKnight et al., 2015). This non-dividing state is induced when yeast exhausts nutrients from the media and involves a marked downregulation in metabolism, histone acetylation, and transcriptional output. Interestingly, quiescence in yeast as in B cells relies on PI3K and TOR signaling (Valcourt et al., 2012). The immune system therefore appears to activate naïve lymphocytes through an ancient regulatory pathway.
Histone methylation and nucleosome remodeling are also likely amplified by the metabolic flux driving B cell activation. First, analogous to HATs and PolII, chromatin remodelers and methyltransferases are poised in G0 chromatin. Second, B cell stimulation leads to increased production of their respective catalytic substrates S-Adenosyl methionine (SAM) and ATP (Figure S3D). Naïve B cells therefore are primed not only transcriptionally but also epigenetically for a rapid response to infection.
Cellular pathways that mediate chromatin decondensation
Decondensation of chromatin has thus far been studied within the context of single-gene loci and by conventional microscopy (Chalut et al., 2012; Therizols et al., 2014). The analyses presented here provide an unprecedented view of this phenomenon owing to the 10-fold increase in imaging resolution, and the fact that B cell activation induces global rather than local changes. The results reveal a marked transformation in the spatial distribution, size, and decompaction of nucleosome clusters. While in naïve cells nucleosomes aggregate as high-density nanodomains in the nuclear periphery, activation leads to their spreading over the entire nucleoplasm mostly as mononucleosome fibers. Mechanistically, we show that spreading is mediated by the amplification of histone acetylation, while decompaction requires Myc and continual ATP synthesis.
Chromatin acetylation weakens nucleosome-DNA interactions by neutralizing positive charges at histone tails. However, in vitro studies have shown that acetylation also impacts higher order structure. In these assays, nucleosome arrays are typically assembled under increasing concentrations of Mg2+. Notably, when hyperacetylated histones have been used, the ability of arrays to self-associate into compacted tertiary structures was impaired (Garcia-Ramirez et al., 1995; Tse et al., 1998; Wang and Hayes, 2008). In light of such results, it is likely that global acetylation of G0 chromatin disrupts interactions that maintain nanodomain clusters in a compacted state. As acetylation progresses, chromatin unfolds over the entire nucleus. Whether all or a subset of acetylation marks carry out this function remains to be determined. In vitro, H4K16Ac alone seems capable of blocking cross-fiber contacts (Shogren-Knaak et al., 2006). Interestingly, H4K16Ac stands among the most amplified chromatin marks during B cell activation. We suspect however that other marks (e.g. histone phosphorylation) might also play a role, owing to their ability to add substantial negative charges to histone tails.
The global decompaction of nucleosome clusters was visible both by MNaseI-Seq and STORM. The role of Myc in this process is likely indirect. One possibility is that it functions via transcriptome amplification, perhaps through the displacement of nucleosomes by the increasing number of elongating polymerases. More likely however, Myc initiates decompaction by activating poised remodeling complexes via enhanced ATP synthesis (Wang et al., 2011). In support of this idea, a 2h block in ATP production fully re-compacts activated B cell chromatin to G0 levels. Such rapid reversal is consistent with the notion that remodeling is a continuous process. By deleting remodeling enzymes in the B cell compartment it should be possible to identify the complexes involved.
Myc and energy input help establish nuclear topology in mammalian cells
Chromatin decondensation was also detected by in situ Hi-C, where it manifested as a marked reduction in long-range contacts and a concomitant increase in short-range ones. This topological shift was linked to nanodomain decompaction, as it depended on Myc and continual energy input. Conversely, chromatin spreading downstream of acetylation was not essential. Considering that B cell chromatin unfolds over an ever-expanding nuclear volume during activation, it might seem counterintuitive that short-range contacts increase in stimulated cells. However, the packaging of DNA within nucleosome-dense nanodomains is expected to minimize free associations in G0 even at short-range, whereas decompaction should promote them.
A key finding was that B cell activation promotes a doubling in the number of loops and loop domains. Furthermore, loops pre-existing in G0 cells are strengthened. The current model of nuclear architecture posits that loops are formed when pairs of extruding cohesin rings are arrested by CTCF at loop anchors (Fudenberg et al., 2016; Sanborn et al., 2015). Correspondingly, deletion of CTCF motifs at selective genomic sites abrogates loop formation. Furthermore, loops and loop domains vanish from the genome when CTCF is conditionally deleted (Nora et al., 2017). Aside from architectural proteins however, the cellular processes that establish nuclear architecture in mammalian cells have been unclear. Our data now show that Myc and continual ATP synthesis are required for loop formation because their depletion reverts the topology of activated B cells to that of G0. Furthermore, as in resting B cells, Rad21 recruitment at affected loop anchors is reduced. These results thus link Myc, and the downstream increase in cellular metabolism, to the anchoring of cohesin complexes at CTCF sites. Conceivably, what is being affected in G0 cells is either cohesin loading or its mobility on chromatin.
Conclusion
Ultimately, chromatin decondensation facilitates B cell transcriptome amplification by at least three mechanisms (Figure 7D). First, the spreading of chromosomes from the periphery to the nuclear interior is expected to evade the transcriptional inhibitory role of the nuclear matrix (Therizols et al., 2014). Second, decompaction of chromatin nanodomains provide accessibility to DNA binding regulatory proteins. Third, the doubling and strengthening of architectural loops enhance the tethering of regulatory DNA across the genome. It is notable that, aside from chromosome repositioning, Myc is upstream of these diverse activities. Thus, by controlling both nanodomain decompaction and PolII promoter escape (Lin et al., 2012; Nie et al., 2012), Myc stands as a master regulator of transcriptome amplification during the humoral immune response.
Contact for Reagent and Resource Sharing
Further information and requests for reagents may be directed to, and will be fulfilled by, the lead contact, Rafael Casellas (rafael.casellas@nih.gov).
Experimental Model and Subject Details
Source of cell lines and mouse models used in the study is reported in the Key Resources Table. All mouse experiments were approved by the NIAMS Animal Care and Use Committee.
Key Resources Table.
| REAGENT or RESOURCE | SOURCE | IDENTIFIER |
|---|---|---|
| Antibodies | ||
| H2b | Abcam | ab1790 |
| h2az | Abcam | ab4174 |
| h2ak9ac | Millipore | 07-289 |
| h2bk120ac | Active motif | 39119 |
| h2bk12ac | Diagenode | C15410212 |
| h2bk20ac | Millipore | MABE351 |
| h2bk5ac | Active motif | 39123 |
| h3k14ac | Millipore | 07-347 |
| h3k18ac | Diagenode | C15410139 |
| h3k23ac | Millipore | 07-355 |
| h3k27ac | abcam | ab4729 |
| h3k36ac | Millipore | 07-540 |
| h3k4ac | Millipore | 07-539 |
| h3k9Ac | abcam | ab4441 |
| h4k12Ac | Millipore | 07-595 |
| h4k16Ac | Millipore | 07-329 |
| h4k5Ac | Millipore | 07-327 |
| h4k8Ac | Millipore | 07-328 |
| h4k91Ac | abcam | ab4627 |
| h2bk5me1 | abcam | ab12929-50 |
| h3k27me1 | Millipore | 07-448 |
| h3k27me2 | abcam | ab24684-25 |
| h3k27me3 | Millipore | 07-449 |
| h3k36me1 | abcam | ab9048 |
| h3k36me2 | abcam | ab9049 |
| h3k36me3 | abcam | ab9050 |
| h3k4me1 | abcam | ab8895 |
| h3k4me2 | Millipore | 07-030 |
| h3k4me3 | Millipore | 04-745 |
| h3k79me1 | Diagenode | C15410082 |
| h3k79me2 | abcam | ab3594 |
| h3k79me3 | abcam | ab2621 |
| h3k9me1 | abcam | ab9045 |
| h3k9me2 | abcam | ab1220 |
| h3k9me3 | abcam | ab8898 |
| h4k20me1 | abcam | ab9051-100 |
| h4k20me3 | Diagenode | C15410207 |
| h3ac | Millipore | 17-615 |
| HDAC1 | abcam | ab7028 |
| HDAC2 | Bethy Laboratories | A300-705A |
| Brg1 | abcam | ab110641 |
| CHD4 | abcam | ab72418 |
| GCN5 | Santa Cruz | sc-20698 |
| p300 | Santa Cruz | sc-585 |
| H3 | Millipore | 05-928 |
| ACL | Bethy Laboratories | A303-866A |
| PDC | Santa Cruz | sc-377092 |
| Bacterial plasmids and Artificial Chromosomes | ||
| pX330-U6-Chimeric_BB-CBh-hSpCas9 | (Cong et al., 2013) | Addgene#42230 |
| pBACe3.6-RP23-145J24 | CHORI | RP23-145J24 |
| pBACe3.6-RP24-192B3 | CHORI | RP24-192B3 |
| pBACe3.6-RP24-245I16 | CHORI | RP24-245I16 |
| pBACe3.6-RP24-239O16 | CHORI | RP24-239O16 |
| Chemicals, Peptides, and Recombinant Proteins | ||
| Medica 16 | Tocris | 4615; CAS: 87272-20-6 |
| TSA | Selleck Chemicals | S1045; CAS:58880-19-6 |
| Tacedinaline | Selleck Chemicals | S2818; CAS:112522-64-2 |
| CAY10398 | Cayman Chemicals | 89740; CAS:193551-00-7 |
| LPS | Sigma | L2630 Sigma |
| IL-4 from mouse | Sigma | SRP3211 Sigma |
| 2-Deoxy-D-glucose | Sigma | D8375 |
| Oligomycin A | Sigma | 75351 |
| Micrococcal Nuclease | NEB | M0247S |
| Tamoxifen | Sigma | T5648 |
| CleanCap™ Cas9 mRNA | Trilink Biotech | L7206 |
| JF549 | Liu et al., 2014 | |
| Critical Commercial Assays | ||
| ATP determination kit | Thermo Fisher | A22066 |
| Ovation Ultralow Library System V2 | Nugen | 344 |
| PicoProbe™Acetyl-CoAFluorometric Assay Kit | BioVision | K317 |
| EasySep™ Mouse B Cell Isolation Kit | Stemcell | 19854 |
| MEGAshortscript™ T7 Transcription Kit | Thermo Fisher | AM1354 |
| Deposited Data | ||
| Raw and analyzed data | This paper | GEO accession #GSE82144 |
| Raw and analyzed data | Mendeley | (http://dx.doi.org/10.17632/c595g7jyh8.2) |
| Experimental Models: Cell Lines | ||
| ES-E14TG2a | ATCC | CRL1821 |
| Experimental Models: Organisms/Strains | ||
| C57BL/6J | Jackson Laboratory | JX664 |
| Myc f/f, ROSA26creERt | (Wang et al., 2011) | |
| JunD-Halo knock-in | This paper | |
| CTCF-Halo knock-in | This paper | |
| Oligonucleotides | ||
| gcccctgaattgctaggaagactg | This paper | cMyc_ flox_S |
| ccgaccgggtccgagtccctatt | This paper | cMyc_flox_AS |
| tcgcgcccctgaattgctaggaa | This paper | cMyc_Δ_ S |
| tgcccagatagggagctgtgatactt | This paper | cMyc_Δ_ AS |
| ACGACCAAGTGACAGCAATG | This paper | cre_S |
| CCATCGCTCGACCAGTTTAG | This paper | cre_AS |
| caccGCTCGGGCTCAGTACGCC | This paper | Jund_sgRNA_#8_F |
| aaacGGCGTACTGAGCCCGAGC | This paper | Jund_sgRNA_#8_R |
| caccgCCTCAGCCACGTCAACAG | This paper | Jund_sgRNA_#10_F |
| aaacCTGTTGACGTGGCTGAGGc | This paper | Jund_sgRNA_#10_R |
| caccGCGTGAGGTCTCCGTTGG | This paper | Ctcf_sgRNA_#4_F |
| aaacCCAACGGAGACCTCACGC | This paper | Ctcf_sgRNA_#4_R |
| caccgCACCACAGACGCCCCCAA | This paper | Ctcf_sgRNA_#8_F |
| aaacTTGGGGGCGTCTGTGGTGc | This paper | Ctcf_sgRNA_#8_R |
| ttaatacgactcactataggGCTCGGGCTCAGTACGCC | This paper | Jund_T7_sgRNA8_F |
| ttaatacgactcactataggCCTCAGCCACGTCAACAG | This paper | Jund_T7_sgRNA10_F |
| ttaatacgactcactataggGCGTGAGGTCTCCGTTGG | This paper | CTCF_T7_sgRNA4_F |
| ttaatacgactcactataggCACCACAGACGCCCCCAA | This paper | CTCF_T7_sgRNA8_F |
| AAAAGCACCGACTCGGTGCC | This paper | T7_sgRNA_R |
| GAGCAGGAGTTCGCCGAAGGC | This paper | Jund_5′_Out_F |
| GAAGGGGAGGAAAGAGGTTAGAGGAGG | This paper | Jund_3′_Out_R |
| GAACCGCCCAGTCATTTCAC | This paper | Ctcf_5′_Out_F |
| AACTTTGCCAAGAAAGAGGCA | This paper | Ctcf_3′_Out_R |
| Recombinant DNA | ||
| pCR-Blunt II-Topo vector | Thermo Fisher | K280002 |
Methods Details
ChIP-seq
Cultured cells were fixed with 1% formaldehyde (Sigma) for 10′ at 37°C. Fixation was quenched by addition of glycine (Sigma) at a final concentration of 125 mM. Twenty million fixed cells were washed with PBS and stored at −80°C until further processing or resuspended in 1 ml of RIPA buffer (10 mM Tris [pH 7.6], 1 mM EDTA, 0.1% SDS, 0.1% sodium deoxycholate, 1% Triton X-100, 1× Complete Mini EDTA free proteinase inhibitor (Roche)). Sonication was performed using Branson sonifier at amplitude 35%, 12 cycles of 20” sonication and 30” of pause. For native chip, chromatin was digested with Mnase (Sigma) in digestion buffer (50 mM Tris-HCl, pH7.6, 1 mM CaCl2, 0.2% Triton X-100, butyrate 5 mM) for 5′ at 37°C and dialyzed against RIPA buffer for 2hrs at 4°C. Five microgram of respective antibody was incubated with 40 μl of Dynabeads Protein A (or G) for 40 min at room temperature. Antibody-bound beads were added to 500 μl of sonicated or Mnase-digested chromatin, incubated at 4°C overnight, and washed twice with RIPA buffer, twice with RIPA buffer containing 0.3M NaCl, twice with LiCl buffer (0.25 M LiCl, 0.5% Igepal-630, 0.5% sodium deoxycholate), once with TE (pH 8.0) plus 0.2% Triton X-100, and once with TE (pH 8.0). Crosslinking was reversed by incubating the beads at 65°C for 4 hr in the presence of 0.3% SDS and 1 mg/ml Proteinase K. ChIP DNA was purified by ChIP DNA clean & concentrator column (Zymo research). Library was prepared in Ovation SP Ultralow library system (Nugen). 50 cycles of sequencing data were acquired on HiSeq2000 or 2500 (Illumina).
Western blot
Nuclear and cytoplasmic fractions from resting and activated B cells was isolated as previously described (Nimura et al., 2006). Protein was transferred onto PVDF membranes and resolved by SDS-PAGE gel electrophoresis. Antibodies used for western blotting are listed in the Key Resources Table.
In situ HiC
A detailed protocol to generate in situ HiC libraries including sequence alignment can be obtained at (Rao et al., 2014).
STORM sample prep and imaging
Resting and activated B cells were incubated for 30 min at 37°C in 500 μl serum-depleted medium to make adhere onto 35mm glass bottom dishes (MatTek, Part No. P35G-1.5-20-C). Then cells were fixed with 4% PFA for 10 min and permeabilized with 0.2% TritonX-100 for 10 min at room temperature and washed twice with PBS. After blocking with 10% BSA for 1 hour at room temperature, cells were incubated overnight at 4°C with the following antibodies: H2B (abcam, ab1790), H3K9me2 (abcam, ab1220), or H3K27Ac (abcam, ab4729) diluted 1/50 with 10% BSA. Primary antibodies were detected with anti-rabbit or anti-mouse IgG F(ab)'2 secondary antibodies (Jackson Immunoresearch) labeled with Alexa Fluor 405 and Alexa Fluor 647 dyes (Thermo Fisher Scientific) in 10% BSA for 1 hour at room temperature. After three washes, cells were fixed with 4% PFA.
STORM imaging was performed with an N-STORM instrument (NIKON) as previously described (Ricci et al., 2015). Briefly, stained cells in MatTek dish was covered with 350 μl of STORM imaging buffer consisting of 50 mM Tris-HCl pH 8.0, 10 mM NaCl, 10% Glucose, 90 mM MEA (SIGMA), 0.5 mg/ml Glucose Oxidase (SIGMA), and 0.03 mg/ml Catalase (SIGMA) and sealed with cover slips. 647 nm laser was used to inactivate all molecules and subsequently 405 nm laser was used to excite Alexa Flour 405 (activator dye) and randomly reactivate neighboring Alexa Flour 647 (reporter dye). Images were acquired via one activation frame followed by three reporter frames (repeated 12,000 times) to capture localization information of most molecules. Exposure time was set to 1 frame in N-STORM software, which made actual exposure time 10 msec ∼ 19 msec.
The chromatin occupied area (Figure 4B) was calculated using Image J software (imageJ.net) using the intensity of the images rendered by Nikon STORM software with the setting of Minimum Height: 2000. H2B clusters were identified with the FindCluster algorithm based on signal localizations as previously described (Ricci et al., 2015). Chromatin distribution across the nucleus (Figure S5A) was determined by measuring the intensity of the images rendered by Nikon STORM software with the setting of Minimum Height: 2000 within 50 equal size bins using Matlab. Wilcoxon rank sum test and KS test were used for statistical analysis.
Myc floxed allele deletion
Myc floxed allele was obtained from Douglas Green (St. Jude Children's research hospital). Myc flox/flox mice (WT) or RosaCreERTam/Myc flox/flox mice (KO) were treated with tamoxifen (three times of i.p. 1mg/mouse at 4, 3 and 1 day before sacrifice). The deletion of floxed allele was checked by PCR or intracellular staining of Myc protein.
B cell culture and Acute ATP depletion
Mature B-cells were isolated from C57BL/6J mouse spleen by negative selection (Stemcell Technologies) and were activated for 3-72h with LPS, Il4, anti-CD180 (Kieffer-kwon et al., 2013). For acute ATP depletion, 20h-activated cells were shifted to glucose deficient media for 2h then, 2-Deoxy-D-glucose (5mM, Sigma) and Oligomycin (126nM, Sigma) were added to the culture for another 1.5-2h before the harvest. ATP level was measured by ATP determination kit (Thermo Fisher Scientific).
Generation of JunDHalo and CtcfHalo mice
sgRNAs recognizing C-terminus of Jund or Ctcf were designed with the online tool (MIT CRISPR Designer) and cloned into pX330 vector (Addgene). 500-600 bp homologous arms were used to construct donor DNA for HaloTag knockin, with silent mutations introduced on 5′ arms to avoid Cas9/sgRNA cutting on the donor DNA. Donor DNA was inserted into pCR-Blunt II-Topo vector (Thermo Fisher), sequenced, digested out and purified for injection. sgRNAs were in vitro transcribed (MEGAshortscript, Ambion), mixed with donor DNA and Cas9 mRNA (Trilink), then injected into zygotes from B6D2F1 or C57BL/6Ncr female mice mated with C57BL/6Ncr male mice to make JunD-Halo or CTCF-Halo knockin mice. Positive pups were bred with C57BL/6J mice to homozygous and maintained in C57BL/6J background. HaloTag knockin mice were also bred with mycflox/floxCreER mice to get JundHalo-mycflox/floxCreER or CtcfHalo-mycflox/floxCreER mice. Primers used for cloning and genotyping are listed in the Key Resources Table.
Live Cell Single Molecule Tracking (SMT)
Resting and activated B cells were incubated with Halo ligand conjugated with JF549 dyes (Janelia Research Campus, 10 nM for JunD-Halo B cells, 2nM for CTCF-Halo B cells) for 15 min at 37°C. After three times washing with PBS, cells were resuspended with 500 μl of serum-depleted B cell medium and plated onto a clean cover glass and incubated at 37°C for 30 min for fast attachment. Immobilized cells were washed two times with imaging medium (ThermoFisher, Fluorobrite DMEM Media, supplemented with all components for B cell culture). Cover glass with cells was then assembled in a cover glass holder, covered by imaging medium and loaded on the microscope for 2D or 3D imaging experiments.
2D single-molecule tracking experiments were performed using a 60×, 1.49 NA objective (Olympus) on a previously described home-built widefield microscope (York et al., 2011), except that we removed the cylindrical lenses from the emission path when conducting imaging. A 561 nm laser (Coherent, Sapphire) was introduced to the microscope body with a dichroic filter (Semrock, Di01-R405/488/561/635 25×36), and served to excite fluorescence from JF549-labeled transcription factors in B cells. Fluorescence was separated from excitation light with the same dichroic and a bandpass emission filter centered at 593 nm (Semrock, FF01-593/40-25), and collected with an electron-multiplying CCD (Andor, DU-888E-C00-#BV). The total magnification between objective and sample was 115.2× (60× objective * 1.6× auxiliary magnification * 1.2× additional magnification), leading to an effective pixel size of 13 μm/115.2 = 113 nm. We measured the power after the objective as 200 μW, which given our imaging field of ∼40 μm diameter, suggests an intensity at the same plane of ∼10 W/cm2. The exposure time was set to 500 ms and 500 frames were recorded for all experiments. Cells were maintained at 37°C with 5% CO2 and proper humidity control, using a microscopy incubation system (Tokai Hit, INU).
3D single-molecule tracking experiments were performed on an epifluorescence microscope appended with an aberration-corrected multifocus system described previously (Abrahamsson et al., 2013; Chen et al., 2014a). Multifocus optics were placed after the primary image plane. Specifically, the diffractive multifocus grating was positioned in the Fourier plane in the emission pathway, and a chromatic correction grating (Tessera) and prism (Rocky Mountain Instruments) refocused images from different focal planes to different positions on the camera chip. Images from nine focal planes (4 μm in the Z direction) were recorded at 33 Hz frame rate simultaneously, with 2000 frames per cell recorded. A 561 nm laser of excitation intensity ∼1KW/cm2 was used.
Imaging processing: 2D and 3D localization and tracking
2D and 3D image data analysis were performed as described before (Chen et al., 2014a). 2D-SMT and 3D-SMT give complementary information. 2D-SMT can reveal the residence time of single molecules as they stably bind to their cognate sites. It can also give the percent of the population of the TF of interest that are stably or transiently bound. 3D-SMT is used for tracking TF movement across all spatial dimensions, which allows for the quantification of the diffusion coefficient and the number of collisions that TFs pass through between binding events at cognate loci. TFs sample DNA frequently between binding events at cognate sites, and the number of times TFs transiently bind then release from DNA between stable binding events is referred to as the number of collisions.
2D spot localization (x,y) was obtained through 2D Gaussian fitting (Serge et al., 2008) using custom MATLAB script. Because the individual diffraction-limited fluorescent spots in our imaging conditions demonstrated a single step photobleaching, each spot represented a single molecule. We fitted the life span (dwell time) of those individual spots with a one- or two-component decay model. The two-component exponential decay model describes the dwell time very well. This partitioned binding events into non-specific and specific interactions, with specific interactions representing more stable and long-lived binding. The dwell time of individual tracks was calculated based on track length and plotted in a 1-cumulative distribution function (1-CDF) histogram to resolve long-lived and short-lived components and their corresponding fractions. Equations S1-4 from the previous publication (Chen et al., 2014a) were used for these calculations.
Prior to 3D spot localization, 3D images were reconstructed by using 200 nm fluorescence beads, which provided a transformation matrix. This enabled superimposing focal planes to an accuracy of ∼10 nm. Deconvolution was then applied to remove the out of focus noise through Huygens software (SVI, Netherlands). 3D spot localization (x,y,z) and single molecule tracking were conducted using FISH-QUANT software (Mueller et al., 2013) and the U-track algorithm (Jaqaman et al., 2008), respectively. The diffusion coefficient was extracted from calculating Mean Square Displacement (MSD) of each trajectory longer than 5 frames (Qian et al., 1992), followed by fitting with a single peak Gaussian function to get the mean value.
Determining the random collisions and specific target search time
The average number of random collisions (events of TF non-specifically sampling DNA) before a TF molecule reaches a cognate target, the duration of a TF freely diffusing in nucleus, and the average search time between two cognate target sites were computed as described by the previous publication (Chen et al., 2014a). We reproduced their mathematic modeling and calculations using following terms:
τs (lifetime of the long-lived, specific component, calculated from 2D-SMT)
τns (lifetime of the short-lived, non-specific component, calculated from 2D-SMT)
Ks (association rate to one specific site)
Kns (association rate to one nonspecific site)
Ns (number of specific binding events in a cell)
Nns (number of nonspecific binding sites in a cell)
Ps (probability for a bound particle to be bound to a specific site)
Pns (probability for a bound particle to be bound to a nonspecific site)
(probability for a free particle to bind to a specific site)
The probability Ps is equal to the probability to observe a specific event weighed by the duration of one event:
| (Equation S1) |
τs, τns are the lifetime of the long-lived and short-lived components calculated from 2D imaging (for details, see Chen et al., 2014).
| (Equation S2) |
where D is the diffusion coefficient, X is the localization and t is the total time. This denotes the ratio of specific to nonspecific observed DNA association rate. Substituting particle's position r into Equation S1 yields:
| (Equation S3) |
and r = τnSPS⁄rS(1 – PS) can be directly calculated.
The probability was calculated as follows:
| (Equation S4) |
With this, gives the average number of trials (Ntrials), or collisions, for a TF to reach a specific binding site. Therefore, the specific target search time τsearch can be calculated as:
| (Equation S5) |
where τ3D is the average time between two binding events. , in which the is the average association rate between of TF and DNA determined from fitting the displacement histogram with a 3D kinetic model (for more details, see Chen et al., 2014).
Fluorescence Recovery After Photobleaching (FRAP) on CtclHalo B cells
CTCF-Halo B cells were stained with 25 μM TMR dye for 15 min, washed three times with PBS, resuspended in serum-depleted B cell medium and plated on 35 mm glass bottom dish (MatTek, P35G-1.5-20-C, 0.16-0.19 mm) that are coated with Cell-Tak (Corning). After 30 min incubation at 37°C, immobilized cells were washed two times with imaging medium and then covered with 2 ml of 37°C 1% low melting agarose (Cambrex, NuSieve GTG Agarose) dissolved in imaging medium and left in room temperature for about 2 min to let agarose to solidify. Solidified agarose will further minimize the movement of cells during FRAP experiment. 1 ml of imaging medium was added on top of agarose before mounting the dish on microscope for imaging.
FRAP experiments were carried out on Zeiss LSM780 confocal microscope with a 63×/1.46 numerical aperture oil immersion objective, and the cells were kept at 37°C in an air stream stage incubator (Nevtek). Bleaching was performed with a 20 nm diameter circular spot using the 561 nm laser operating at 100% laser power. A single iteration was used for the bleach pulse between cycle 5 and 6, and fluorescence recovery was monitored at low laser intensity (0.1% of a 20 mW laser) at 10 ms intervals for a total of 120 cycles. Data from at least three independent experiments were collected and used to generate corresponding average FRAP curves (±SEM). Curves were normalized as previously described (Stavreva et al., 2004).
FRAP kinetic model
Model design: two phenomenological binding models were tested. Only one was satisfactory; it consists of three classes of binding sites, fast, slow and very slow (or “immobile”). These binding sites compete for a pool of free CTCF, making a total of four compartments. Each binding or unbinding process is characterized by a single rate constant. To model the FRAP, this model is duplicated so that all compartments exist in both the bleached and the unbleached ROIs. The two free pools are connected by processes representing the diffusion of free CTCF into and from the bleached ROI. Corresponding binding and unbinding parameters in the two ROIs are assumed equal. Diffusion is assumed to be fast on the time scale of the FRAP experiment, and the fast component of the FRAP recovery is assumed to represent relatively non-specific (fast) binding. The ratio of the parameters representing diffusion between the bleached and unbleached ROIs is constrained by the measured fraction of pixels bleached (0.0162); the absolute magnitude of these diffusion parameters was set so that the slowest of them was 10-fold faster than the fastest of the binding sites. Note that the “on” rate constants are effective first order rate constants, and should not be conflated with the actual second order rate constants.
Alternative hypothesis: the second model included only two classes of binding sites (slow and very slow) and required that diffusion account for the fast component of the FRAP response. This alternative model was rejected because it could not fit the FRAPS in both resting and activated B cells with the same values of the diffusion parameters.
Numerical and simulation methods: models were allowed to relax to a steady state and then, at the start of the bleach, an additional exponential decay process was added to each of the compartments in the bleached ROI. This represents the experimental photobleaching process, and the bleaching parameters were returned to zero after the experimentally set bleach duration, allowing unbinding and diffusion to supply the fluorescence that reappears in the bleached ROI. The differential equations for this system were solved in the ProcessDB (www.integrativebioinformatics.com/processdb) software (Kruhlak et al., 2007) using the classic stiff/non-stiff numerical integrator, CVODE (Cohen and Hindmarsh, 1996).
Parameter estimation: numerical values of all the parameters, including the bleaching parameters, in the resting B cell model were determined by least squares fitting of the entire FRAP data profile from pre-bleach through bleaching itself, and the full kinetics of recovery. All data points were weighted with fractional standard deviations of 0.2, and parameter estimation was carried out using the widely adopted software package, ODRPACK95 (Boggs et al., 1989). Parameters characterizing CTCF binding in resting B cells were determined with coefficients of variation from 0.9% to 4.1%. Because the data for activated B cells are noisier, the corresponding coefficients of variation show greater uncertainty (1.4% to 75.3%). Residence times are calculated as the inverse of the corresponding Koff rate constants. Percent bound and free and the percent of bound that is fast, slow, or immobile are the calculated distributions at steady state for the model with the reported optimized parameter values.
High-throughput 3D DNA FISH
High-throughput fluorescence in-situ hybridization (HiFISH) was performed as described previously (Shachar et al., 2015). Probes were generated via nick translation from bacterial artificial chromosomes (BACs). The BACs used for short range were: RP23-145J24 and RP24-192B3 and for long range: RP24-245I16 and RP24-239O16 (all from CHORI). Mixes, reagents, and conditions are exactly as in (Finn et al., 2017). All experiments were performed in triplicate.
For short range interactions on chromosome 4, imaging was performed in three channels (DAPI: 405 nm excitation and 445 nm/45 nm emission filter; Green: 488 nm excitation and 525 nm/50 nm emission filter, and Far red: 640 nm excitation and 676 nm/29 nm emission filter) in an automated fashion using a spinning disk high-throughput confocal microscope (Yokogawa CV7000), using a 60× water immersion lens (NA = 1.2) and no pixel binning (pixel size = 108 nm). 16 fields were imaged per well and 11 z-planes spanning 10 μm. Three images were acquired in two exposures; the first exposure was the DAPI channel alone, in the second exposure both green and far red images were taken simultaneously. At least 2000 spot pairs were analyzed in each condition.
Automated image analysis was performed via a custom Columbus pipeline as previously described (Finn et al., 2017). This pipeline automates nucleus detection based on the maximal projection of the DAPI image (ex. 405 nm) to identify cells. Spots within these cells are subsequently identified in maximal projections of the Green (ex. 488 nm) and Red (ex. 561 nm) images, using local (relative to the surrounding pixels) and global (relative to the entire nucleus) contrast filters. The x and y coordinates of the brightest pixel in each spot were calculated and datasets containing the coordinates, as well as row, column, field, cell, and spot indices, were exported as tab separated text files. These spot position datasets were imported in R. 2D distances for each pair of Red:Green probes within a cell were calculated using the SpatialTools R package, minimal distances were calculated with the data.table R package, and cumulative distance distributions were generated with the ggplot2 R package. All images, scripts, and datasets are available upon request.
Bioinformatics
Software
Bedops 2.4.3 to 2.4.14 (Neph et al., 2012b)
Bedtools 2.17 to 2.25 (Quinlan and Hall, 2010)
Bowtie 1.1.1 and 2-2.2.3 (Langmead and Salzberg, 2012)
Bwtool (Pohl and Beato, 2014)
Fastqc 0.11.4 (http://www.bioinformatics.babraham.ac.uk/projects/fastqc)
Fqtrim-v0.94 (https://github.com/gpertea/fqtrim/tree/v0.9.4)
ggplot2 R package 1.0.1 (Wickham, 2009)
HTseq (Andres et al., 2014)
Illumina CASAVA 1.8.2
Juicer and Juicebox (Rao et al., 2014)
MACS 1.4.2 and 2.1.0 (Zhang et al., 2008)
Perl 5.18.2 (https://www.perl.org)
Python 3.3.2 (https://www.python.org)
R 3.2.0 to 3.2.3 (Wien, 2012)
Samtools 0.1.19 to 1.2 (Li et al., 2009)
UCSC utilities 308-311
SICER 1.1 (Zang et al., 2009)
UCSC Browser (Kent et al., 2002)
Wiggletools (Zerbino et al., 2014)
Previously published analyzed data sets used in this study
Mouse G0 and activated B cell Bi-Seq data (SRX347820, SRX370339, SRX370352, SRX370353), activated B cell polII ChIA-PET data (SRX347373), activated B cell RNA-Seq (spike-in) (SRX367207, SRX367208), DHS hotspots and footprints definition, annotation of DHS regions into Promoters and Enhancers (SRP029721, (Kieffer-Kwon et al., 2013)). Active and inactive compartments definition from Pro-B Hi-C data, Super-Enhancer definition, Regulatory clusters (groups of DHS elements) (Qian et al., 2014)
ChIP-Seq, GRO-seq, MNase-Seq, ATAC-Seq and HiC-seq processing
Reads were sequenced using the illumina Genome Analyzer II and the Illumina HiSeq 2000 or 2500, following the manufacturer's instructions. The standard piple line (1.8.2) was used for image analysis and base calling. The software Fastqc was applied to the fastq files to check up the quality of reads such as adapter content and sequence duplication levels.
Alignment of ChIP-Seq and GRO-Seq
Reads were aligned to the National Center for Biotechnology Information mouse genome data (July 2007; NCBI37/mm9) by using alignment software Bowtie with the following options: -S –m 1 –p [num_of_thread] -a --best --strata –n 2 –l [read_length]. These options report reads that align uniquely to the best stratum and allowing up to 2 mismatches. For GRO-Seq, additionally 2 nucleotides from the 5′ end were trimmed before aligning with option ‘--trim5 2’.
Alignment of MNase-Seq and ATAC-Seq
Pair-end reads were aligned to the National Center for Biotechnology Information mouse genome data (July 2007; NCBI37/mm9) by using alignment software Bowtie2. For MNase-Seq, using “fqtrim -A 125 -q 20 -f adapters -p22 -P33” command, adapters and low quality regions were trimmed. For alignment, the following options were used: --phred33 --trim3 5 --local --sensitive-local –I 0 –X 1000 --no-discordant --no-mixed --fr --no-unal –p [num_of_thread]. These options locally align reads after trimming 5 nucleotide from the 3′ end and report reads that align concordantly where mate 1 appears upstream of the reverse complement of mate 2 within 0 to 1000 fragment size range. For ATAC-Seq, the following options were used: --sensitive --end-to-end –I 0 –X 1000 --no-discordant --no-mixed --fr --no-unal –p [num_of_thread]. These options report reads that align globally and concordantly where mate 1 appears upstream of the reverse complement of mate 2 within 0 to 1000 fragment size range. Then, unassembled random contigs were removed using the “sed ‘/random/d;chrUn/d’ “ command.
HiC analysis
Data pre-processing and normalization
We used juicer software to filter reads and subsequently normalize the ligation frequency matrices as previously published (Rao et al., 2014). All the normalized data corresponds to matrices balanced using the Knight-Ruiz algorithm as published (Rao et al., 2014). We next used the juicebox dump function to extract the normalized matrices from the .hic files. Unless otherwise stated, we used custom R scripts to perform analysis described below.
HiC domain calling
We used juicer software to call domains with the default parameters.
Identification of Topologically Associating Domains (TAD)
We inferred the boundaries of TADs by calculating the directionality index (DI) for each 5kb bin, which indicates for each bin whether it interacts predominately with bins to its left or right (Dixon et al., 2012).
DI is defined as
Ai - sum of the normalized signal within a window of 1Mb to the left of the bin i,
Bi - sum of the normalized signal within a window of 1Mb to the right of the bin i.
Ei = (Ai + Bi) / 2, This value corresponds to the number of interactions without directionality of the considered bin.
To find TADs, we first identify DI threshold (ThrDI) as the median of the |DI| (excluding the first and last 4Mb of each chromosome). We worked with positive (P) and negative (N) DI values separately. We identified peaks on |DI| for both subsets (P and N, peaks were defined as regions with at least two consecutive bins with |DI|>ThrDI). Boundaries were identified as bins between a N and a P peak. The end of last bin of the negative peak was considered as the start of the boundary region and the beginning of the first bin of the positive peak was considered as the end of the boundary region. TADs were set as regions between the end and the start of two consecutive boundaries.
We defined shared TADs as TADs having similar start and end positions in G0 and activated cells. As a reference, we used the boundaries identified in the resting conditions. Given the uncertainty in boundary identification, we extended the TAD boundary coordinates by ±50 kb in both conditions and used these extended boundary coordinates to identify shared TADs.
Inter- and intra-domain interactions
To estimate the ratios of intra-domain interactions in G0 and activated cells we focused on the shared domains. We removed the diagonal and the first off diagonal from consideration and summed up the normalized signal within the shared domains in G0 and activated cells.
The ratio of inter-domain interactions between G0 and activated cells was computed as follows. In addition to the common domains, we defined pseudo domains, as the genomic intervals between the common domains. In this way, we obtained genomic coordinates of counting bins (CB) with no gaps. Then, we summed up the normalized signal the CBs genome-wide. The inter-domain interactions represent therefore interactions between shared domains and between shared domains and pseudo- domains as well as between pseudo domains.
Average profile of in situ Hi-C signal at loops
Common and induced loops were defined based on the overlap of loop anchors. Additionally, FC of at least 1.3 between the two conditions was required to identify induced and repressed loops. For each loop, we defined its midpoint (i.e. the central pixel) as the coordinates of the central bin of the loops' left and right-hand side anchors. We next isolated the normalized in-situ Hi-C signal in a square matrix centered at the loop midpoint and computed a per pixel average of the signal.
As the samples differed (albeit moderately) in the total coverages, we adopted a slightly different approach to produce APA for Figure 7B. We extracted contact probabilities from the .hic files and worked with these values instead of the pseudo count values presented in other Hi-C heatmaps. All the APA profiles presented in Figure 7B are drawn in the same color-scale (average probability values from the range between 0-0.003).
Inference of the ratio of regulatory to non-regulatory element Hi-C signal in activated versus G0 B cells
We used normalized Hi-C contact matrices at the resolution of 5kb. We considered the list of DHS which were identified as either common to G0 and activated B cells or seen only in activated B cells.
As regulatory element interactions, we set bin pairs whereby both bins overlapped DHS site(s). As non-regulatory, we considered bins pairs which did not overlap any known or putative regulatory or epigenetic element (annotation from the activate condition; the elements included: active or inactive promoter, super-enhancer, active or poised enhancer; peak of: CTCF, Rad21, H3K27me3 or H3K9me3).
To accurately reflect the interaction strength between regulatory and non-regulatory elements in the genome, we focused only on interactions which occur within the same interaction domain (Rao et al., 2014). Importantly, we considered only domains which did not contain any other domain. Finally, to compute the log2 ratio of the normalized signal, we considered bin pairs which displayed Hi-C signal in both G0 and activated cells.
Contact probability profile
Contact probability (Ins(s)) is calculated as described previously (Sanborn et al. 2015). For each chromosome,
s = linear distance, r=Mapping resolution (5kb), N = sequence length of a chromosome
Ins(s) = Iactual(s)/Ipossible(s)
Iactual(s) = sum of normalized contact numbers at distance s
Ipossible(s) = L-s*r - 1
Genome-wide Ins(s) is median values of chromosomal Ins(s). We displayed Ins(s) plots in log scale at both axes after smoothing with the R package smooth.spline function.
Comparison of mRNA-seq changes inside loop domains
Previous published RNA-seq reads were mapped to RefSeq genes with htseq-count -m intersection-nonempty and fold-change and p-values were calculated using the R package DESeq2. Genes with less than 20 normalized counts in average at both conditions were removed for analysis.
ChIP-seq data analysis
Density tracks for visualization
Density tracks were generated using custom software based on the samtools library to count the number of reads in 100 bp windows normalized to window size and library size to obtain densities in units of reads per kb region per million mapped reads (rpkm) across the genome. Up to 2 redundant reads were allowed. For Gro-Seq data tracks, to generate stranded track, density tracks were generated differently by using bedtools genomecov program (Quinlan, 2014) with a normalizing scale factor to calculate rpm. For MNase-Seq data tracks, to convert bam files to bigwig files, custom software, which calculates the kernel density estimate of nucleosome dyads from paired-end sequencing data, was used. Using wiggletools ratio and diff program, the difference track of ratio of MNase signal to input signal on G0 and activated B cell were calculated. Tracks were smoothed and sometimes log-transformed in the UCSC genome browser.
Normalization of ChIP-Seq data
To directly compare the extent of histone acetylation or methylation between G0 and activated B cells, we applied the following normalization protocol. First, we normalized each ChIP-Seq sample based on sequence depth and region size (read per kilobase per million map reads or RPKM) to account for differences in library size. Next, we applied the MACS2 peak caller to identify areas of enriched signal to 27 of 35 histone marks based on input DNA. For modifications that do not form distinct peaks but typically display diffuse enrichment (H3K9me1/2/3, H3K27me3, H3K36me1/3, H4K20me1, H3K4me1) the SICER program was used instead with the following options: mm9, 1, 500, 130, 0.79, 1500, and 100. For H3K9me2, which showed extreme diffusion the options were mm9, 1, 5000, 130, 0.79, 5000, and 200. Following the application of MACS2 or SICER, non-peak areas (defined as non-specific background signal) were used to perform the final normalization to directly compare chromatin marks between the two cell types. In all cases, non-redundant reads were used (PCR duplicate reads were removed) and the background ratio was calculated by shifting reads by half of the estimated fragment size.
Count data at DHS promoter/enhancer elements and Super enhancer regions
DHS promoter/enhancer elements and Super enhancer regions for G0 and activated B cells were previously defined (Kieffer-Kwon et al., 2013; Qian et al., 2014). Each region was subdivided into 200nt windows. Reads were shifted by half the estimated fragment size (ChIP-Seq data) or not shifted (all others) and counted in the window with custom software based on the samtools library after removing redundant reads. Maximum counts among windows were transformed into rpkm and/or background normalization scaling factor was multiplied. The boxplots summarizing the signal at selected regions were produced with the R package ggplot2. In contrast, for Gcn5 ChIP-Seq data in Figure S2.C, reads were counted on the peak regions, which were called by macs v1.4.2 with default option, using HTseq program and rpkm value were calculated to see the difference between G0 and activated B cells.
Compartmental analysis on ChIP-Seq, MNase-Seq and Bi-Seq data
Chromatin A (euchromatin) and B (heterochromatin) compartments were defined in proB cells (Qian et al. 2014). 1,994 euchromatin regions plus 50 kb of upstream and downstream heterochromatin (flanks) were considered for these analyses, To plot a composite view of the various signals, we first split all euchromatin regions into 10 nt and all flanks into 100 nt bins. Next, we selected 1000 relative, equally spaced positions on euchromatin. For the flanks, all bins were used, resulting in a set of 2000 bins for each of the 1,994 regions. For ChIP-seq, aligned reads were counted in these 2000 bins using bedtools. Counts were background-normalized as above. For MNase-Seq data, the per bp ratios of MNase treated to input sample (see below) was averaged for each bin. For Bi-Seq data, the average percentages of methylated C nucleotides (Kieffer-Kwon et al., 2013) were calculated for each bin. Finally, the median value for each bin was calculated across the 1,994 regions and plotted (dots in figures) with the R package ggplot2 to compare G0 and activated B cells. The line represents a smoothed conditional mean obtained with the geom_smooth() function (span=0.2).
Median fold change calculation for ChIP-Seq data
Peak calling procedure is same as described on the Background normalization section. Merged peak regions on G0 and active B cell with bedops program were subdivided into 200 nt windows for histone modification having relatively narrow peaks. After counting reads on those 200nt windows by custome software with a fixed 150nt fragment size, which were described above, maximum count among windows were selected. For histone modifications having relatively broad peaks, reads were counted on whole peak region rather than 200nt windows. Then, the fold change of normalized counts on peak regions of active B cells to G0 B cells were calculated with 0.01 pseudo count to avoid arithmetic underflow. If median values were less than 1, reverse of median values of fold change with minus sign were plotted.
MNase-Seq analysis on promoters, enhancers and other regulatory elements
The previous definitions of promoter and enhancer of G0 and aB cells based on DHS hotspots were used (Kieffer-Kwon et al., 2013). Promoters were classified by RNA-Seq expression level of genes in each cell type. The silent promoter were defined by having no-expressed genes. Promoters of which genes were expressed highly (within upper 3rd fraction after removing no- or trace- expressed genes determined by mclust R package for normal mixture model-based classification) were defined as active. Enhancer regions commonly accessible on both cell types based on DHS hotspots were selected to compare them at both cell types. The nucleosome dyad density as measured by the ratio of mapped reads of MNase treated samples over input samples were plotted around promoter and enhancer regions (Figure3 A and B). The ratio of MNase signals over input signals +/-50kb around polII ChIA-PET clusters were plotted to show the composite view around regulatory elements (FigureS4 B). The aggregated data were produced by shrinking/expanding the polII ChIA-PET clustered regions minus 2kb boundary regions to 200 bp with bwtool agg program after converting bam files to bigwig files by custom software as described on the density tracks section.
Comparison of ChIP-seq signal at loop anchors
The comparative analysis of ChIP-seq signal for CTCF and Rad21 was divided into three parts: (i) identification of enriched regions (peaks), (ii) read shift and counting and (iii) normalization of ChIP signal across conditions. In the first part, ChIP-seq .bam files from biological replicates for G0 and activated cells (time point 72h) were merged into single .bam file per condition. The merged .bam file was subsequently used for peak calling with MACS2 using the default parameters along with the matched input samples. Peak lists in G0 and activated conditions were merged using bedops tool (Neph et al., 2012a). In the second part, read coordinates were shifted by the inferred ChIP-fragment half size (150bp), in the direction of the center of the peak. At this point of the analysis, we have identified CTCF bound regions in G0 and activated cells corresponding to the time-points at which in situ Hi-C maps were probed (CTCF peak coordinates). We designed a dedicated experiment to accurately monitor activation-induced dynamics of CTCF and Rad21 binding. We performed 24h activation of G0 cells with LPS and Il4. We prepared crosslinked and sonicated chromatin extracts from two biological replicat samples for each condition mixed them with a known amount of sonicated human chromatin as spike-in controls and performed ChIP-seq experiments to detect CTCF and Rad21. After read alignment, a custom program was used to count the number of reads overlapping CTCF peak coordinates after shifting in each sample. We used estimateSizeFactors function from the DESeq2 package (Love et al., 2014) to obtain library size specific normalization factors (size factors, SF) for peak coverages in each sample. At this stage of the analysis, we have computed a normalized CTCF and Rad21 score at each CTCF peak in all the four samples (two biological replicates before and after 24h activation). We computed the average normalized ChIP signal for each CTCF peak. We considered common and induced loops which overlapped a single CTCF peak at both anchors. Next, for each loop we identified the anchor with highest induction in CTCF signal at the CTCF peak upon activation. Lastly, we used the multiecdf function from the geneplotter package in R/Bioconductor, to display log2(FC) of the ChIP-seq signal.
Quantification and Statistical Analysis
The statistical significance of differences between datasets was determined by Student T test using the R package. Statistical details of experiments can be found in the figure legends.
Data and Software Availability
Deep-sequencing data is deposited at GEO# GSE82144. Original imaging and Western blot data used to generate any of the figure panels have been deposited to Mendeley Data and are available at http://dx.doi.org/10.17632/c595g7jyh8.2
Supplementary Material
Movie S1: JunD dynamics in 3D by single molecule tracking. Related to Figure 5. The movie shows the mobility of JunD-Halo in activated B cells as determined by 3D microscopy in 9 planes.
Movie S2: JunD dynamics in 2D by single molecule tracking. Related to Figure 5. The mobility of JunD-Halo is shown in activated B cells using 2D microscopy.
Table S1: HiC contact signals between cognate promoter-enhancer pairs as defined by PolII ChIA-PET. Related to Figure 7.
Acknowledgments
We thank Gustavo Gutierrez and Stefania Dell'Orso for assistance with deep-sequencing, Xufeng Wu and Panagiotis Chandris for assistance with STORM, Doug Green for myc-/- mice. This work was supported by the Intramural Research Programs of NIAMS and NCI. K.N. was supported by the Daiichi Sankyo Foundation of Life Science. Animal experiments were performed according to NIH approved protocols. This study used the high-performance computational capabilities of NIH Helix Systems (http://helix.nih.gov).
Footnotes
Author Contributions: R.C. and E.L.A. designed experiments. K.K., K.N., J.X., E.S., S.R., L.B., Y.Z., F.T.A., D.S., S.N., M.M., A.C., E.F., C.G., S.M.J., and Z.L. performed experiments. W.D. maintained the mouse colonies. S.J., A.P., M.D., S.R., E.M., S.H., W.R., and R.D.P. performed bioinformatics analyses. P.C., D.R.G., M.P.C., E.B., D.L., T.M., L.T., G.H., M.L., M.F., and H.S. provided expert advice. R.C. wrote the manuscript
Conflict of Interest Statement: The authors declare no conflicts of interest.
Publisher's Disclaimer: This is a PDF file of an unedited manuscript that has been accepted for publication. As a service to our customers we are providing this early version of the manuscript. The manuscript will undergo copyediting, typesetting, and review of the resulting proof before it is published in its final citable form. Please note that during the production process errors may be discovered which could affect the content, and all legal disclaimers that apply to the journal pertain.
References
- Abrahamsson S, Chen J, Hajj B, Stallinga S, Katsov AY, Wisniewski J, Mizuguchi G, Soule P, Mueller F, Dugast Darzacq C, et al. Fast multicolor 3D imaging using aberration-corrected multifocus microscopy. Nat Methods. 2013;10:60–63. doi: 10.1038/nmeth.2277. [DOI] [PMC free article] [PubMed] [Google Scholar]
- Andres S, Pyl PT, Huber W. HTSeq — A Python framework to work with high-throughput sequencing data. 2014 doi: 10.1093/bioinformatics/btu638. [DOI] [PMC free article] [PubMed] [Google Scholar]
- Blair D, Dufort FJ, Chiles TC. Protein kinase Cbeta is critical for the metabolic switch to glycolysis following B-cell antigen receptor engagement. Biochem J. 2012;448:165–169. doi: 10.1042/BJ20121225. [DOI] [PubMed] [Google Scholar]
- Boggs PT, Donaldson JR, Byrd RH, Schnabel RB. Algorithm 676: software for weighted orthogonal distance regression. ACM Transactions on Mathematical Software (TOMS) 1989;15 [Google Scholar]
- Bunting KL, Soong TD, Singh R, Jiang Y, Beguelin W, Poloway DW, Swed BL, Hatzi K, Reisacher W, Teater M, et al. Multi-tiered Reorganization of the Genome during B Cell Affinity Maturation Anchored by a Germinal Center-Specific Locus Control Region. Immunity. 2016;45:497–512. doi: 10.1016/j.immuni.2016.08.012. [DOI] [PMC free article] [PubMed] [Google Scholar]
- Caretti G, Di Padova M, Micales B, Lyons GE, Sartorelli V. The Polycomb Ezh2 methyltransferase regulates muscle gene expression and skeletal muscle differentiation. Genes Dev. 2004;18:2627–2638. doi: 10.1101/gad.1241904. [DOI] [PMC free article] [PubMed] [Google Scholar]
- Chalut KJ, Hopfler M, Lautenschlager F, Boyde L, Chan CJ, Ekpenyong A, Martinez-Arias A, Guck J. Chromatin decondensation and nuclear softening accompany Nanog downregulation in embryonic stem cells. Biophysical journal. 2012;103:2060–2070. doi: 10.1016/j.bpj.2012.10.015. [DOI] [PMC free article] [PubMed] [Google Scholar]
- Chen J, Smoyer CJ, Slaughter BD, Unruh JR, Jaspersen SL. The SUN protein Mps3 controls Ndc1 distribution and function on the nuclear membrane. J Cell Biol. 2014a;204:523–539. doi: 10.1083/jcb.201307043. [DOI] [PMC free article] [PubMed] [Google Scholar]
- Chen J, Zhang Z, Li L, Chen BC, Revyakin A, Hajj B, Legant W, Dahan M, Lionnet T, Betzig E, et al. Single-molecule dynamics of enhanceosome assembly in embryonic stem cells. Cell. 2014b;156:1274–1285. doi: 10.1016/j.cell.2014.01.062. [DOI] [PMC free article] [PubMed] [Google Scholar]
- Cohen SD, Hindmarsh AC. CVODE, A Stiff/Nonstiff ODE Solver in C. Computers in Physics. 1996;10 [Google Scholar]
- Dixon JR, Selvaraj S, Yue F, Kim A, Li Y, Shen Y, Hu M, Liu JS, Ren B. Topological domains in mammalian genomes identified by analysis of chromatin interactions. Nature. 2012;485:376–380. doi: 10.1038/nature11082. [DOI] [PMC free article] [PubMed] [Google Scholar]
- Dowen JM, Fan ZP, Hnisz D, Ren G, Abraham BJ, Zhang LN, Weintraub AS, Schuijers J, Lee TI, Zhao K, et al. Control of cell identity genes occurs in insulated neighborhoods in mammalian chromosomes. Cell. 2014;159:374–387. doi: 10.1016/j.cell.2014.09.030. [DOI] [PMC free article] [PubMed] [Google Scholar]
- Finn EH, Pegoraro G, Shachar S, Misteli T. Comparative analysis of 2D and 3D distance measurements to study spatial genome organization. Methods. 2017 doi: 10.1016/j.ymeth.2017.01.007. [DOI] [PMC free article] [PubMed] [Google Scholar]
- Flavahan WA, Drier Y, Liau BB, Gillespie SM, Venteicher AS, Stemmer-Rachamimov AO, Suva ML, Bernstein BE. Insulator dysfunction and oncogene activation in IDH mutant gliomas. Nature. 2016;529:110–114. doi: 10.1038/nature16490. [DOI] [PMC free article] [PubMed] [Google Scholar]
- Fudenberg G, Imakaev M, Lu C, Goloborodko A, Abdennur N, Mirny LA. Formation of Chromosomal Domains by Loop Extrusion. Cell Rep. 2016;15:2038–2049. doi: 10.1016/j.celrep.2016.04.085. [DOI] [PMC free article] [PubMed] [Google Scholar]
- Garcia-Ramirez M, Rocchini C, Ausio J. Modulation of chromatin folding by histone acetylation. J Biol Chem. 1995;270:17923–17928. doi: 10.1074/jbc.270.30.17923. [DOI] [PubMed] [Google Scholar]
- Gebhardt JC, Suter DM, Roy R, Zhao ZW, Chapman AR, Basu S, Maniatis T, Xie XS. Single-molecule imaging of transcription factor binding to DNA in live mammalian cells. Nat Methods. 2013;10:421–426. doi: 10.1038/nmeth.2411. [DOI] [PMC free article] [PubMed] [Google Scholar]
- Gifford CA, Ziller MJ, Gu H, Trapnell C, Donaghey J, Tsankov A, Shalek AK, Kelley DR, Shishkin AA, Issner R, et al. Transcriptional and epigenetic dynamics during specification of human embryonic stem cells. Cell. 2013;153:1149–1163. doi: 10.1016/j.cell.2013.04.037. [DOI] [PMC free article] [PubMed] [Google Scholar]
- Guo Y, Xu Q, Canzio D, Shou J, Li J, Gorkin DU, Jung I, Wu H, Zhai Y, Tang Y, et al. CRISPR Inversion of CTCF Sites Alters Genome Topology and Enhancer/Promoter Function. Cell. 2015;162:900–910. doi: 10.1016/j.cell.2015.07.038. [DOI] [PMC free article] [PubMed] [Google Scholar]
- Hakim O, Resch W, Yamane A, Klein I, Kieffer-Kwon KR, Jankovic M, Oliveira T, Bothmer A, Voss TC, Ansarah-Sobrinho C, et al. DNA damage defines sites of recurrent chromosomal translocations in B lymphocytes. Nature. 2012;484:69–74. doi: 10.1038/nature10909. [DOI] [PMC free article] [PubMed] [Google Scholar]
- Hardy RR, Hayakawa K. Selection of natural autoreactive B cells. Clin Exp Rheumatol. 2015;33:S80–86. [PubMed] [Google Scholar]
- Heath HE. CTCF: Comprehending The Complex Functions of an 11 zinc finger transcription factor. Erasmus University Rotterdam: 2007. [Google Scholar]
- Jaehning JA, Stewart CC, Roeder RG. DNA-dependent RNA polymerase levels during the response of human peripheral lymphocytes to phytohemagglutinin. Cell. 1975;4:51–57. doi: 10.1016/0092-8674(75)90133-6. [DOI] [PubMed] [Google Scholar]
- Jaqaman K, Loerke D, Mettlen M, Kuwata H, Grinstein S, Schmid SL, Danuser G. Robust single-particle tracking in live-cell time-lapse sequences. Nature methods. 2008;5:695–702. doi: 10.1038/nmeth.1237. [DOI] [PMC free article] [PubMed] [Google Scholar]
- Kent WJ, Sugnet CW, Furey TS, Roskin KM, Pringle TH, Zahler AM, Haussler D. The human genome browser at UCSC. Genome Res. 2002;12:996–1006. doi: 10.1101/gr.229102. [DOI] [PMC free article] [PubMed] [Google Scholar]
- Kieffer-Kwon KR, Tang Z, Mathe E, Qian J, Sung MH, Li G, Resch W, Baek S, Pruett N, Grøntved L, et al. Interactome maps of mouse gene regulatory domains reveal basic principles of transcriptional regulation. Cell. 2013;155:1507–1520. doi: 10.1016/j.cell.2013.11.039. [DOI] [PMC free article] [PubMed] [Google Scholar]
- Kouzine F, Wojtowicz D, Yamane A, Resch W, Kieffer-Kwon KR, Bandle R, Steevenson N, Nakahashi H, Awasthi P, Feigenbaum L, et al. Global regulation of promoter melting in naïve lymphocytes Cell. 2013;153:988–999. doi: 10.1016/j.cell.2013.04.033. [DOI] [PMC free article] [PubMed] [Google Scholar]
- Kruhlak M, Crouch EE, Orlov M, Montano C, Gorski SA, Nussenzweig A, Misteli T, Phair RD, Casellas R. The ATM repair pathway inhibits RNA polymerase I transcription in response to chromosome breaks. Nature. 2007;447:730–734. doi: 10.1038/nature05842. [DOI] [PubMed] [Google Scholar]
- Langmead B, Salzberg SL. Fast gapped-read alignment with Bowtie 2. Nat Methods. 2012;9:357–359. doi: 10.1038/nmeth.1923. [DOI] [PMC free article] [PubMed] [Google Scholar]
- Li H, Handsaker B, Wysoker A, Fennell T, Ruan J, Homer N, Marth G, Abecasis G, Durbin R. The Sequence Alignment/Map format and SAMtools. Bioinformatics. 2009;25:2078–2079. doi: 10.1093/bioinformatics/btp352. [DOI] [PMC free article] [PubMed] [Google Scholar]
- Lin CY, Loven J, Rahl PB, Paranal RM, Burge CB, Bradner JE, Lee TI, Young RA. Transcriptional amplification in tumor cells with elevated c-Myc. Cell. 2012;151:56–67. doi: 10.1016/j.cell.2012.08.026. [DOI] [PMC free article] [PubMed] [Google Scholar]
- Love MI, Huber W, Anders S. Moderated estimation of fold change and dispersion for RNA-seq data with DESeq2. Genome Biol. 2014;15:550. doi: 10.1186/s13059-014-0550-8. [DOI] [PMC free article] [PubMed] [Google Scholar]
- Loven J, Orlando DA, Sigova AA, Lin CY, Rahl PB, Burge CB, Levens DL, Lee TI, Young RA. Revisiting global gene expression analysis. Cell. 2012;151:476–482. doi: 10.1016/j.cell.2012.10.012. [DOI] [PMC free article] [PubMed] [Google Scholar]
- Lupianez DG, Kraft K, Heinrich V, Krawitz P, Brancati F, Klopocki E, Horn D, Kayserili H, Opitz JM, Laxova R, et al. Disruptions of topological chromatin domains cause pathogenic rewiring of gene-enhancer interactions. Cell. 2015;161:1012–1025. doi: 10.1016/j.cell.2015.04.004. [DOI] [PMC free article] [PubMed] [Google Scholar]
- McKnight JN, Boerma JW, Breeden LL, Tsukiyama T. Global Promoter Targeting of a Conserved Lysine Deacetylase for Transcriptional Shutoff during Quiescence Entry. Mol Cell. 2015;59:732–743. doi: 10.1016/j.molcel.2015.07.014. [DOI] [PMC free article] [PubMed] [Google Scholar]
- Mueller F, Senecal A, Tantale K, Marie-Nelly H, Ly N, Collin O, Basyuk E, Bertrand E, Darzacq X, Zimmer C. FISH-quant: automatic counting of transcripts in 3D FISH images. Nature methods. 2013;10:277–278. doi: 10.1038/nmeth.2406. [DOI] [PubMed] [Google Scholar]
- Nakahashi H, Kwon KR, Resch W, Vian L, Dose M, Stavreva D, Hakim O, Pruett N, Nelson S, Yamane A, et al. A Genome-wide Map of CTCF Multivalency Redefines the CTCF Code. Cell Rep. 2013;3:1678–1689. doi: 10.1016/j.celrep.2013.04.024. [DOI] [PMC free article] [PubMed] [Google Scholar]
- Neph S, Kuehn MS, Reynolds AP, Haugen E, Thurman RE, Johnson AK, Rynes E, Maurano MT, Vierstra J, Thomas S, et al. BEDOPS: high-performance genomic feature operations. Bioinformatics. 2012a;28:1919–1920. doi: 10.1093/bioinformatics/bts277. [DOI] [PMC free article] [PubMed] [Google Scholar]
- Neph S, Vierstra J, Stergachis AB, Reynolds AP, Haugen E, Vernot B, Thurman RE, John S, Sandstrom R, Johnson AK, et al. An expansive human regulatory lexicon encoded in transcription factor footprints. Nature. 2012b;489:83–90. doi: 10.1038/nature11212. [DOI] [PMC free article] [PubMed] [Google Scholar]
- Nie Z, Hu G, Wei G, Cui K, Yamane A, Resch W, Wang R, Green DR, Tessarollo L, Casellas R, et al. c-Myc Is a Universal Amplifier of Expressed Genes in Lymphocytes and Embryonic Stem Cells. Cell. 2012;151:68–79. doi: 10.1016/j.cell.2012.08.033. [DOI] [PMC free article] [PubMed] [Google Scholar]
- Nimura K, Ishida C, Koriyama H, Hata K, Yamanaka S, Li E, Ura K, Kaneda Y. Dnmt3a2 targets endogenous Dnmt3L to ES cell chromatin and induces regional DNA methylation. Genes Cells. 2006;11:1225–1237. doi: 10.1111/j.1365-2443.2006.01012.x. [DOI] [PubMed] [Google Scholar]
- Nora EP, Goloborodko A, Valton AL, Gibcus JH, Uebersohn A, Abdennur N, Dekker J, Mirny LA, Bruneau BG. Targeted Degradation of CTCF Decouples Local Insulation of Chromosome Domains from Genomic Compartmentalization. Cell. 2017;169:930–944.e922. doi: 10.1016/j.cell.2017.05.004. [DOI] [PMC free article] [PubMed] [Google Scholar]
- Pogo BG, Allfrey VG, Mirsky AE. RNA synthesis and histone acetylation during the course of gene activation in lymphocytes. Proc Natl Acad Sci U S A. 1966;55:805–812. doi: 10.1073/pnas.55.4.805. [DOI] [PMC free article] [PubMed] [Google Scholar]
- Pohl A, Beato M. bwtool: a tool for bigWig files. Bioinformatics. 2014;30:1618–1619. doi: 10.1093/bioinformatics/btu056. [DOI] [PMC free article] [PubMed] [Google Scholar]
- Qian H, Elson EL, Frieden C. Studies on the structure of actin gels using time correlation spectroscopy of fluorescent beads. Biophysical journal. 1992;63:1000–1010. doi: 10.1016/S0006-3495(92)81686-7. [DOI] [PMC free article] [PubMed] [Google Scholar]
- Qian J, Wang Q, Dose M, Pruett N, Kieffer-Kwon KR, Resch W, Liang G, Tang Z, Mathe E, Benner C, et al. B Cell Super-Enhancers and Regulatory Clusters Recruit AID Tumorigenic Activity. Cell. 2014;159:1524–1537. doi: 10.1016/j.cell.2014.11.013. [DOI] [PMC free article] [PubMed] [Google Scholar]
- Quinlan AR. BEDTools: The Swiss-Army Tool for Genome Feature Analysis. Curr Protoc Bioinformatics. 2014;47:11 12 11–34. doi: 10.1002/0471250953.bi1112s47. [DOI] [PMC free article] [PubMed] [Google Scholar]
- Quinlan AR, Hall IM. BEDTools: a flexible suite of utilities for comparing genomic features. Bioinformatics. 2010;26:841–842. doi: 10.1093/bioinformatics/btq033. [DOI] [PMC free article] [PubMed] [Google Scholar]
- Rao SS, Huntley MH, Durand NC, Stamenova EK, Bochkov ID, Robinson JT, Sanborn AL, Machol I, Omer AD, Lander ES, et al. A 3D map of the human genome at kilobase resolution reveals principles of chromatin looping. Cell. 2014;159:1665–1680. doi: 10.1016/j.cell.2014.11.021. [DOI] [PMC free article] [PubMed] [Google Scholar]
- Rawlings JS, Gatzka M, Thomas PG, Ihle JN. Chromatin condensation via the condensin II complex is required for peripheral T-cell quiescence. EMBO J. 2011;30:263–276. doi: 10.1038/emboj.2010.314. [DOI] [PMC free article] [PubMed] [Google Scholar]
- Ricci MA, Manzo C, Garcia-Parajo MF, Lakadamyali M, Cosma MP. Chromatin fibers are formed by heterogeneous groups of nucleosomes in vivo. Cell. 2015;160:1145–1158. doi: 10.1016/j.cell.2015.01.054. [DOI] [PubMed] [Google Scholar]
- Sanborn AL, Rao SS, Huang SC, Durand NC, Huntley MH, Jewett AI, Bochkov ID, Chinnappan D, Cutkosky A, Li J, et al. Chromatin extrusion explains key features of loop and domain formation in wild-type and engineered genomes. Proc Natl Acad Sci U S A. 2015;112:E6456–6465. doi: 10.1073/pnas.1518552112. [DOI] [PMC free article] [PubMed] [Google Scholar]
- Schones DE, Cui K, Cuddapah S, Roh TY, Barski A, Wang Z, Wei G, Zhao K. Dynamic regulation of nucleosome positioning in the human genome. Cell. 2008;132:887–898. doi: 10.1016/j.cell.2008.02.022. [DOI] [PMC free article] [PubMed] [Google Scholar]
- Serge A, Bertaux N, Rigneault H, Marguet D. Dynamic multiple-target tracing to probe spatiotemporal cartography of cell membranes. Nature methods. 2008;5:687–694. doi: 10.1038/nmeth.1233. [DOI] [PubMed] [Google Scholar]
- Shachar S, Voss TC, Pegoraro G, Sciascia N, Misteli T. Identification of Gene Positioning Factors Using High-Throughput Imaging Mapping. Cell. 2015;162:911–923. doi: 10.1016/j.cell.2015.07.035. [DOI] [PMC free article] [PubMed] [Google Scholar]
- Shogren-Knaak M, Ishii H, Sun JM, Pazin MJ, Davie JR, Peterson CL. Histone H4-K16 acetylation controls chromatin structure and protein interactions. Science. 2006;311:844–847. doi: 10.1126/science.1124000. [DOI] [PubMed] [Google Scholar]
- Srinivasan L, Sasaki Y, Calado DP, Zhang B, Paik JH, DePinho RA, Kutok JL, Kearney JF, Otipoby KL, Rajewsky K. PI3 kinase signals BCR-dependent mature B cell survival. Cell. 2009;139:573–586. doi: 10.1016/j.cell.2009.08.041. [DOI] [PMC free article] [PubMed] [Google Scholar]
- Stavreva DA, Muller WG, Hager GL, Smith CL, McNally JG. Rapid glucocorticoid receptor exchange at a promoter is coupled to transcription and regulated by chaperones and proteasomes. Mol Cell Biol. 2004;24:2682–2697. doi: 10.1128/MCB.24.7.2682-2697.2004. [DOI] [PMC free article] [PubMed] [Google Scholar]
- Sutendra G, Kinnaird A, Dromparis P, Paulin R, Stenson TH, Haromy A, Hashimoto K, Zhang N, Flaim E, Michelakis ED. A nuclear pyruvate dehydrogenase complex is important for the generation of acetyl-CoA and histone acetylation. Cell. 2014;158:84–97. doi: 10.1016/j.cell.2014.04.046. [DOI] [PubMed] [Google Scholar]
- Tang Z, Luo OJ, Li X, Zheng M, Zhu JJ, Szalaj P, Trzaskoma P, Magalska A, Wlodarczyk J, Ruszczycki B, et al. CTCF-Mediated Human 3D Genome Architecture Reveals Chromatin Topology for Transcription. Cell. 2015;163:1611–1627. doi: 10.1016/j.cell.2015.11.024. [DOI] [PMC free article] [PubMed] [Google Scholar]
- Therizols P, Illingworth RS, Courilleau C, Boyle S, Wood AJ, Bickmore WA. Chromatin decondensation is sufficient to alter nuclear organization in embryonic stem cells. Science. 2014;346:1238–1242. doi: 10.1126/science.1259587. [DOI] [PMC free article] [PubMed] [Google Scholar]
- Tse C, Sera T, Wolffe AP, Hansen JC. Disruption of higher-order folding by core histone acetylation dramatically enhances transcription of nucleosomal arrays by RNA polymerase III. Mol Cell Biol. 1998;18:4629–4638. doi: 10.1128/mcb.18.8.4629. [DOI] [PMC free article] [PubMed] [Google Scholar]
- Valcourt JR, Lemons JM, Haley EM, Kojima M, Demuren OO, Coller HA. Staying alive: metabolic adaptations to quiescence. Cell Cycle. 2012;11:1680–1696. doi: 10.4161/cc.19879. [DOI] [PMC free article] [PubMed] [Google Scholar]
- Wang R, Dillon CP, Shi LZ, Milasta S, Carter R, Finkelstein D, McCormick LL, Fitzgerald P, Chi H, Munger J, et al. The transcription factor Myc controls metabolic reprogramming upon T lymphocyte activation. Immunity. 2011;35:871–882. doi: 10.1016/j.immuni.2011.09.021. [DOI] [PMC free article] [PubMed] [Google Scholar]
- Wang X, Hayes JJ. Acetylation mimics within individual core histone tail domains indicate distinct roles in regulating the stability of higher-order chromatin structure. Mol Cell Biol. 2008;28:227–236. doi: 10.1128/MCB.01245-07. [DOI] [PMC free article] [PubMed] [Google Scholar]
- Wellen KE, Hatzivassiliou G, Sachdeva UM, Bui TV, Cross JR, Thompson CB. ATP-citrate lyase links cellular metabolism to histone acetylation. Science. 2009;324:1076–1080. doi: 10.1126/science.1164097. [DOI] [PMC free article] [PubMed] [Google Scholar]
- Wickham H. ggplot2: elegant graphics for data analysis. Springer; New: 2009. [Google Scholar]
- Wien W. R: A Language and Environment for Statistical Computing 2012 [Google Scholar]
- Yamaguchi T, Cubizolles F, Zhang Y, Reichert N, Kohler H, Seiser C, Matthias P. Histone deacetylases 1 and 2 act in concert to promote the G1-to-S progression. Genes Dev. 2010;24:455–469. doi: 10.1101/gad.552310. [DOI] [PMC free article] [PubMed] [Google Scholar]
- York AG, Ghitani A, Vaziri A, Davidson MW, Shroff H. Confined activation and subdiffractive localization enables whole-cell PALM with genetically expressed probes. Nat Methods. 2011;8:327–333. doi: 10.1038/nmeth.1571. [DOI] [PMC free article] [PubMed] [Google Scholar]
- Zang C, Schones DE, Zeng C, Cui K, Zhao K, Peng W. A clustering approach for identification of enriched domains from histone modification ChIP-Seq data. Bioinformatics. 2009;25:1952–1958. doi: 10.1093/bioinformatics/btp340. [DOI] [PMC free article] [PubMed] [Google Scholar]
- Zerbino DR, Johnson N, Juettemann T, Wilder SP, Flicek P. WiggleTools: parallel processing of large collections of genome-wide datasets for visualization and statistical analysis. Bioinformatics. 2014;30:1008–1009. doi: 10.1093/bioinformatics/btt737. [DOI] [PMC free article] [PubMed] [Google Scholar]
- Zhang Y, Liu T, Meyer CA, Eeckhoute J, Johnson DS, Bernstein BE, Nusbaum C, Myers RM, Brown M, Li W, et al. Model-based analysis of ChIP-Seq (MACS) Genome Biol. 2008;9:R137. doi: 10.1186/gb-2008-9-9-r137. [DOI] [PMC free article] [PubMed] [Google Scholar]
Associated Data
This section collects any data citations, data availability statements, or supplementary materials included in this article.
Supplementary Materials
Movie S1: JunD dynamics in 3D by single molecule tracking. Related to Figure 5. The movie shows the mobility of JunD-Halo in activated B cells as determined by 3D microscopy in 9 planes.
Movie S2: JunD dynamics in 2D by single molecule tracking. Related to Figure 5. The mobility of JunD-Halo is shown in activated B cells using 2D microscopy.
Table S1: HiC contact signals between cognate promoter-enhancer pairs as defined by PolII ChIA-PET. Related to Figure 7.