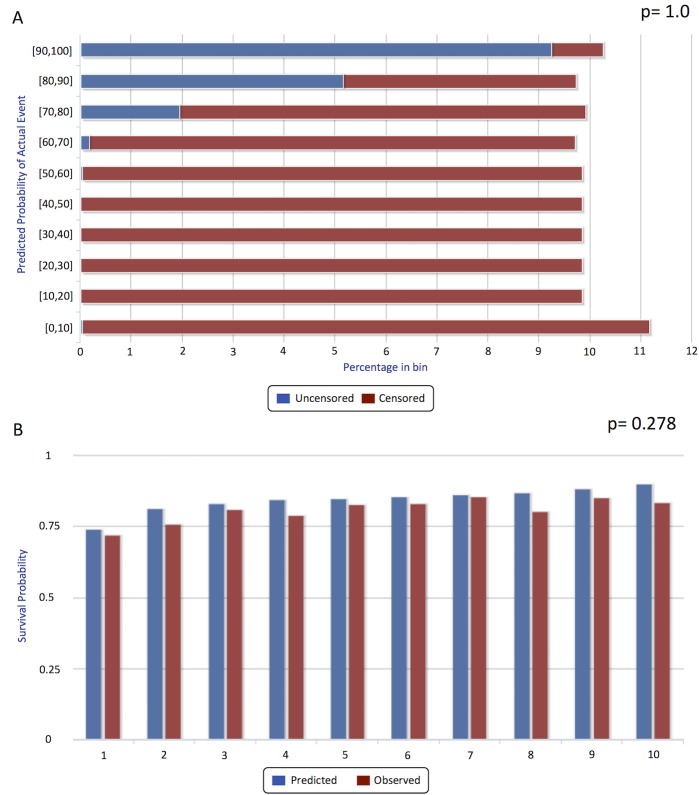
Fig 4. Distribution-calibration and single-point calibration (1-calibration).
Panel A shows the observed distribution of events (death) histogram for each predicted decile of the survival distribution. The “p-value” here (1.0) is the result of the χ2test. Panel B shows the 5-years post post-transplant goodness-to-fit calibration (a.k.a. 1-calibration) histogram. Blue bars correspond to predicted and red bars to observed events, for each deciles of risk category according to the model. The p-value is 0.278, suggesting good calibration (Hosmer–Lemeshow).

