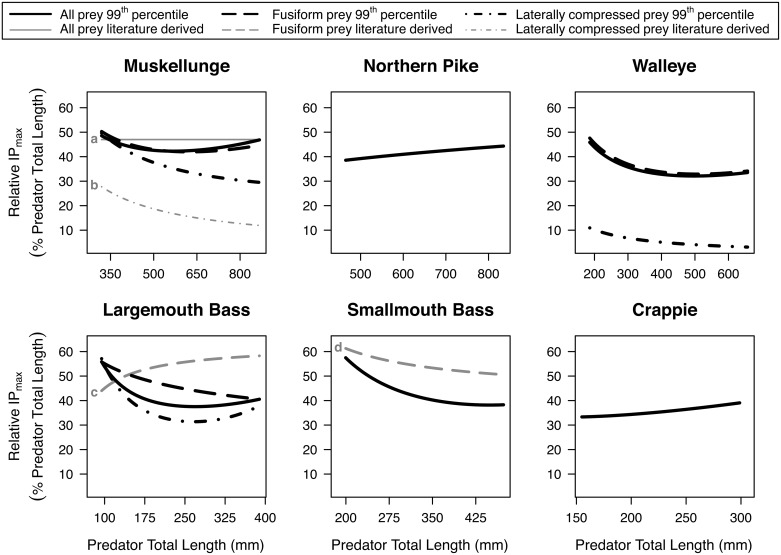
Fig 2. The relative maximum ingested prey total length (percent of predator total length) consumed across predator total length.
Piscivores evaluated include muskellunge (Esox masquinongy), northern pike (Esox lucius), walleye (Sander vitreus), largemouth bass (Micropterus salmoides), smallmouth bass (Micropterus dolomieu), and a grouped ‘crappie’ category (P. nigromaculatus and P. annularis). The relative IPmax (99th percentile regression) is shown from the 5th to 95th percentile of observed predator total lengths, which are noted on the top axes of Fig 1. When applicable, we estimated relative IPmax for different prey body shapes: fusiform (dashed lines) and laterally compressed (dotted lines). Literature derived data are for a field survey of all prey [24]; b field survey of gizzard shad (Dorosoma cepedianum) as prey [45], c gape-limit for largemouth bass as prey [46], and d field survey of Cyprinids as prey [14]. Additional literature derived estimates are reported in S3 Appendix.

