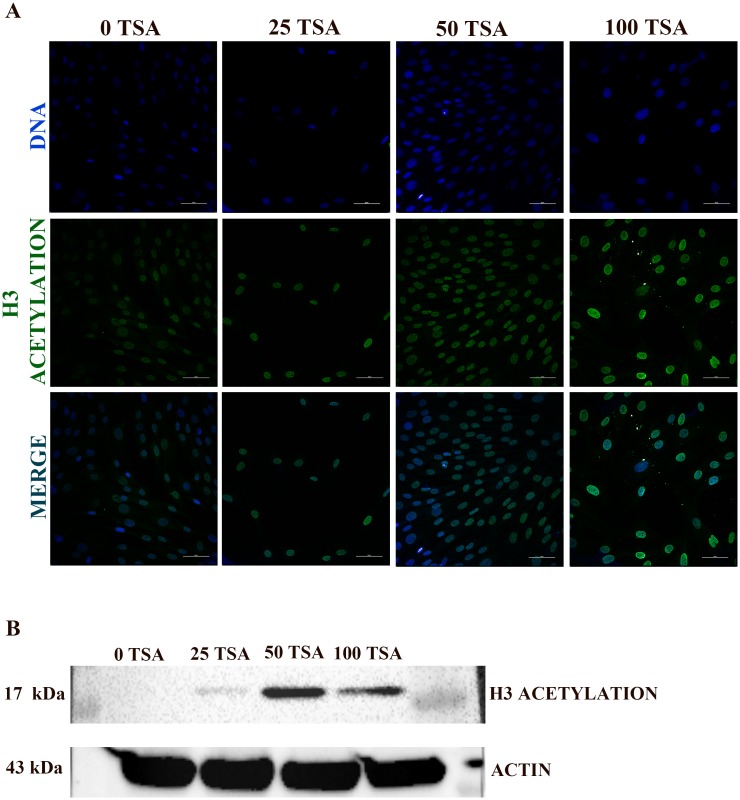
Fig 4. Acetyl-Histone H3.
(A) Acetyl-Histone H3 Immunostaining. Left column: 0 TSA; second: 25 TSA; third: 50 TSA; fourth: 100 TSA. Top row: DNA stained with DAPI; centre row: Acetyl-Histone H3 immunofluorescence; bottom row: merge. Scale bars represent: 50 μm. (B) Acetyl-Histone H3 Western immunoblotting.

