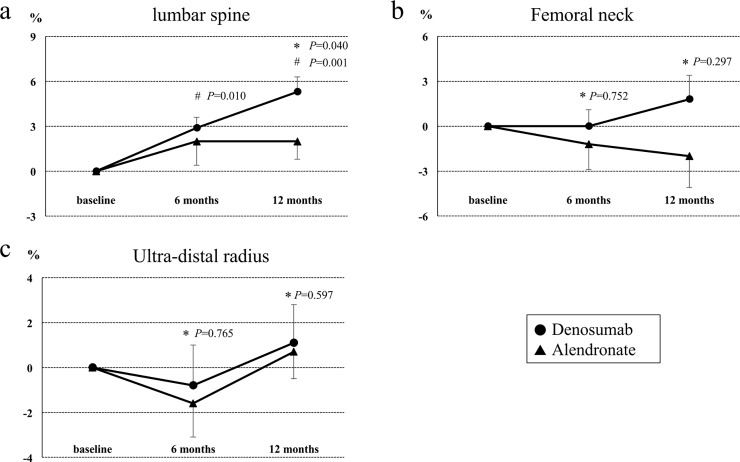
Fig 3. Effects of denosumab and alendronate on BMD.
Percent changes (mean ± SEM) in bone mineral density from baseline to 12 months in the lumbar spine (A), femoral neck (B), and ultra-distal radius (C) in the denosumab and alendronate groups. *P compared with the alendronate group (by Wilcoxon’s rank sum test). #P compared with baseline (by Wilcoxon’s signed rank test).

