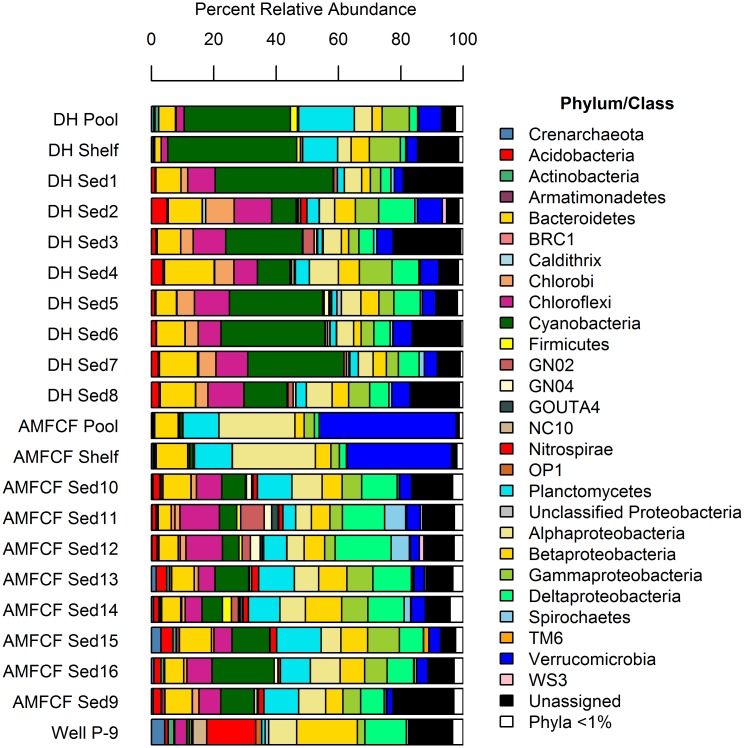
Fig 2. Prokaryotic community composition.
Phylum-level taxonomic bar chart for prokaryotic communities from Devils Hole (DH), Ash Meadows Fish Conservation Facility (AMFCF), and Well P-9 constructed from the final unrarefied OTU table (S1 Appendix). Planktonic samples (“pool”, “shelf”, and “Well P-9”) and sediment samples (“Sed1-Sed16”), each representing a discrete sample, are noted. The Proteobacteria were subdivided into classes. Only microbial groups with abundances ≥ 1% are displayed. Groups with < 1% abundances are included in aggregate as “Phyla < 1%”.

