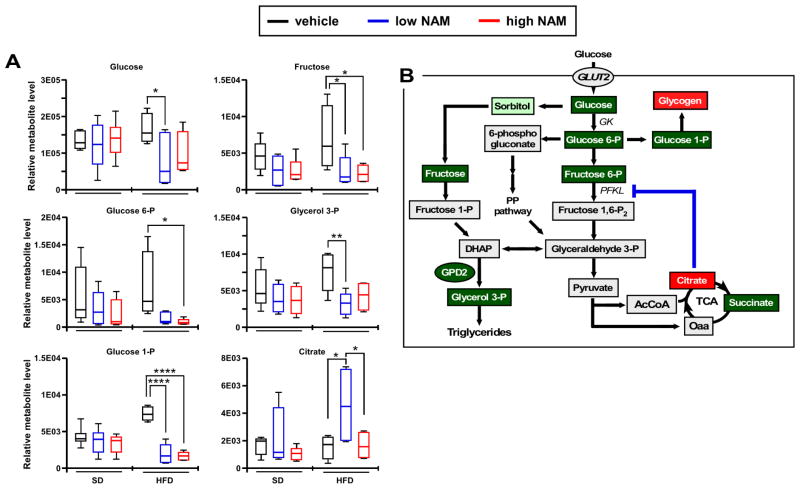
Figure 2. Impact of NAM on hepatic metabolites profile in mice fed SD or HFD.
(A) Metabolomics analysis illustrating the relative levels of glucose, fructose, glucose 6-phosphate, glucose 1-phosphate, glycerol 3-phosphate, and citrate (n=6/group; metabolites key: red, accumulated; green, depleted) (B) Diagram depicting the alteration in glycolytic metabolite concentrations in HFD livers in response to low NAM supplementation. The blockade of phosphofructokinase, liver type (PFKL) by citrate may account for the reduced formation of glyceraldehyde 3-phosphate, which is central in several metabolic pathways. The depletion in glucose 1-phosphate suggests active glycogen synthesis in response to NAM supplementation. All box plots represent 6 mice/group. *, p<0.05; **, p<0.01; ***, p<0.001; ****, p<0.0001. (See also Figure S2).

