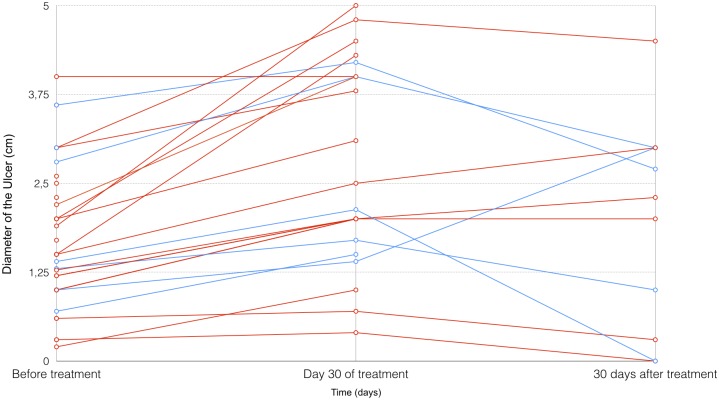
Fig 2. Multi-series line chart representing the size of each ulcer before treatment, at 30 days of treatment and after 30 days after the completion of treatment.
The red lines represent increasing ulcer size, and the blue lines represent decreasing ulcer size. The lines that stop at day 30 represent the lesions of patients who suffered treatment failure and requested rescue treatment. Lesions that appeared after 30 days of completing treatment were new lesions.

