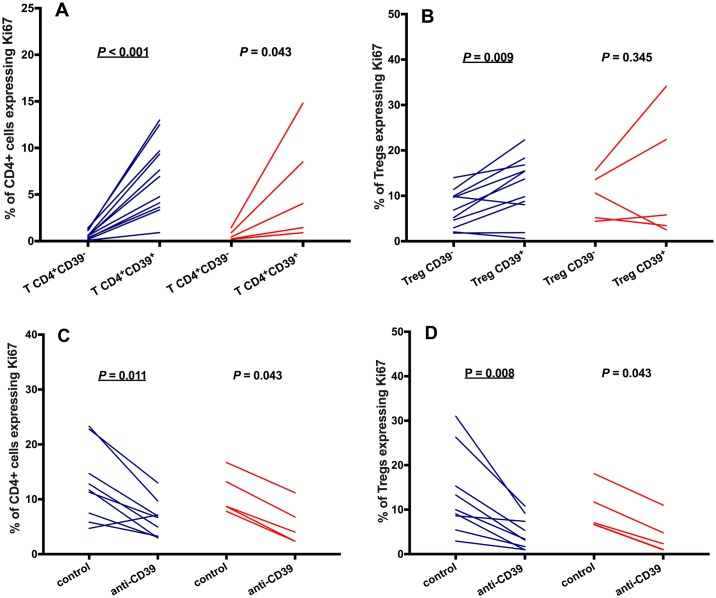
Fig 6. Reduced Ki67 expression in CD4+CD39+ T cells following CD39 blocking.
PBMC from microfilaremic (Fil+) and uninfected (Fil-) subjects were stained for intracellular Ki67, an indicator of T-cell proliferation. We first compared the proportion of Ki67+ cells among CD4+CD39+ and CD4+CD39- T cells (panel A) and CD39+ and CD39- Treg (CD4+CD25hiCD127-FoxP3+) cells (panel B). Next, we compared the proportion of Ki67+ cells among CD4+ T cells (panel C) and Treg cells (panel D) in the presence or absence of anti-CD39 antibody (“anti-CD39” and “control”, respectively). Individual data are shown for 11 Fil+ and 5 Fil- subjects (panels A and B) or 9 Fil+ and 5 Fil- subjects (panels C and D) and were compared using the Wilcoxon signed rank test. Significant P values after controlling for a false discovery rate (q) set at 0.10 are underlined (number of comparisons m = 5 for each group, Fil+ and Fil-).

