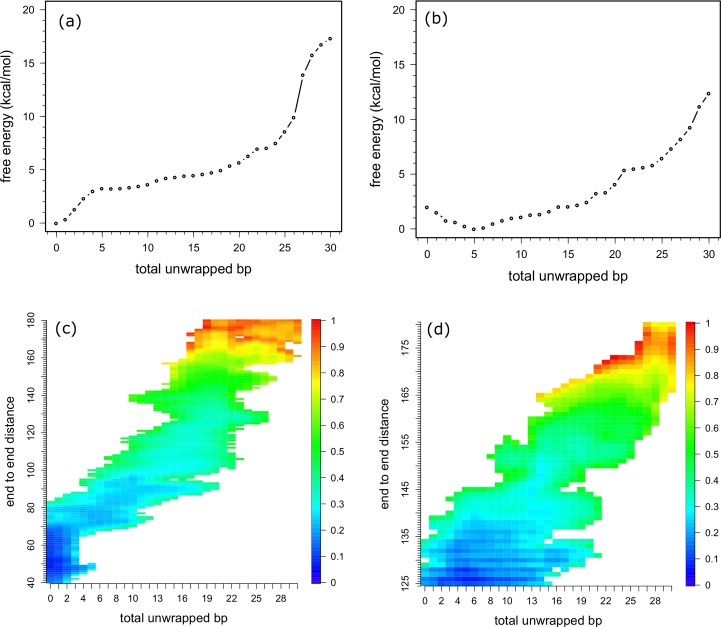
Fig 3.
Free energy profiles plotted as a function of the total number of unwrapped bps (a) and (b), or as a function of the total number of unwrapped bps and end-to-end distance (c) and (d). (a) and (c) stage 1. (b) and (d) stage 2. Colors in (c) and (d) denote the relative free energy in each stage.

