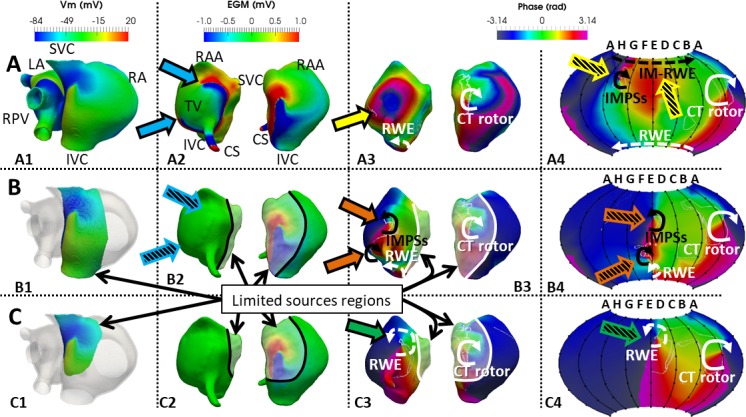
Fig 8. Effect of the far-field sources.

Maps for the endocardial and CT positioned basket were generated for 3 different distributions of sources. All maps are shown at t = 4935 ms. A) Sources include the whole RA and LA (A1), B) sources include tissue only encompassing the CT rotor and the RWE at the IVC (B1), and C) sources include only tissue encompassing the CT rotor (C1). A2, B2 and C2: Voltage maps of the EGMs computed on the endocardium-blood interface corresponding to the whole (A2) and limited atrial sources (B2 and C2). Blue arrows (A2) indicate edges of EGM wave propagating around the TV. Hatched blue arrows in B2 indicate that once the sources are removed from the TV region, no significant voltage gradients are visible in that location. A3, B3 and C3: Phase maps computed on the EGMs maps from the endocardium-blood interface. In the whole sources map (A1), no PS is visible at the moment of this analysis (yellow arrow indicates a short living PS at earlier time). Orange arrows (B3) indicate PS outside of the sources region which is therefore an IMPS resulting from far field sources. Green arrow (C3) indicates a dramatic shift of the RWE into a region outside of the sources region. A4, B4 and C4: Phase maps from the recordings of the virtual basket. Hatched yellow arrows (A4) show IMPS in the region of the TV and an imaginary rotor wave extension (IM-RWE) around the basket north-pole (see text). Hatched orange arrows (B4) indicate the IMPS on the basket phase map. C4 is the basket phase map with limited sources shown in C1. Hatched green arrow indicates a PS corresponding to the RWE, but with a dramatic shift in location relative to A4. White and black lines on B2-3 and C2-3 depict the limits of the sources region. CT rotor: rotor along the crista terminalis; RWE: rotor wave extension; IMPS: imaginary phase singularity; IM-RWE: Imaginary RWE; LA and RA: left and right atrium; RPV: right pulmonary veins; SCV and IVC: superior and inferior vena cava; RAA: right atrial appendage; CS: coronary sinus; TV: tricuspid valve.
