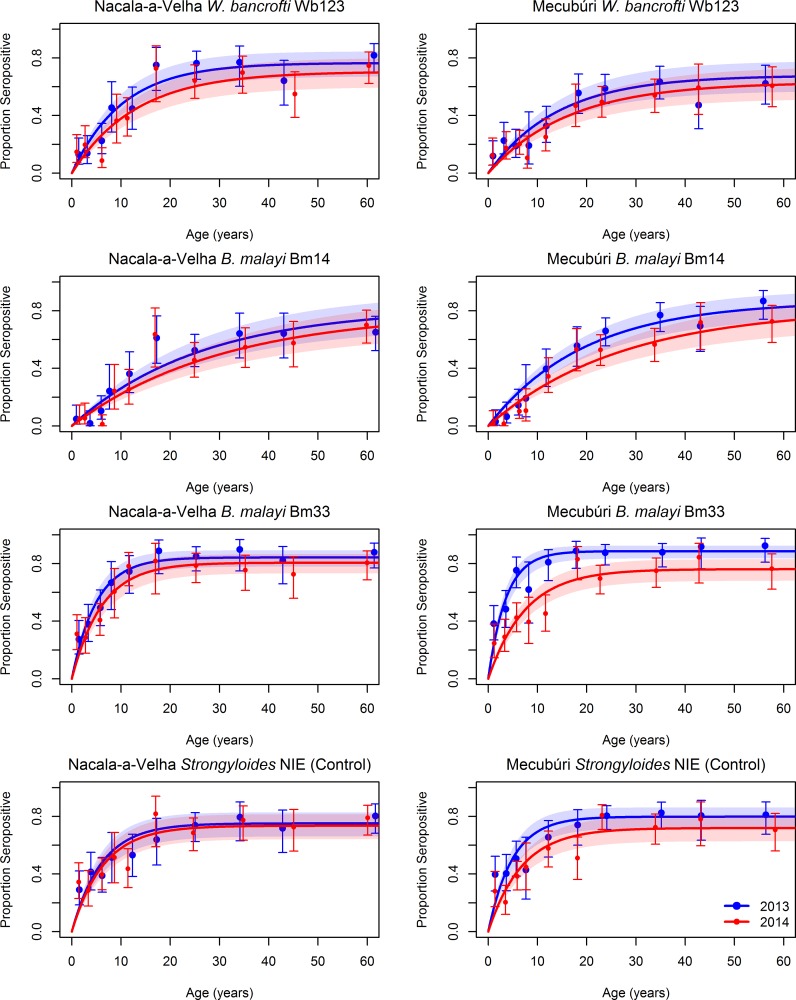
Fig 3. Seropositivity by age for antibodies to three lymphatic filariasis antigens and the Strongyloides NIE (control) antigen in community members sampled during household surveys in Nacala-a-Velha and Mecubúri Districts, Northern Mozambique, 2013–2014.
Points represent estimates and 95% confidence intervals for seropositivity for each age category, curves represent the fit of a catalytic conversion model, and shaded areas represent the 95% confidence intervals of model fit: blue for 2013, red for 2014, and purple for the overlap.

