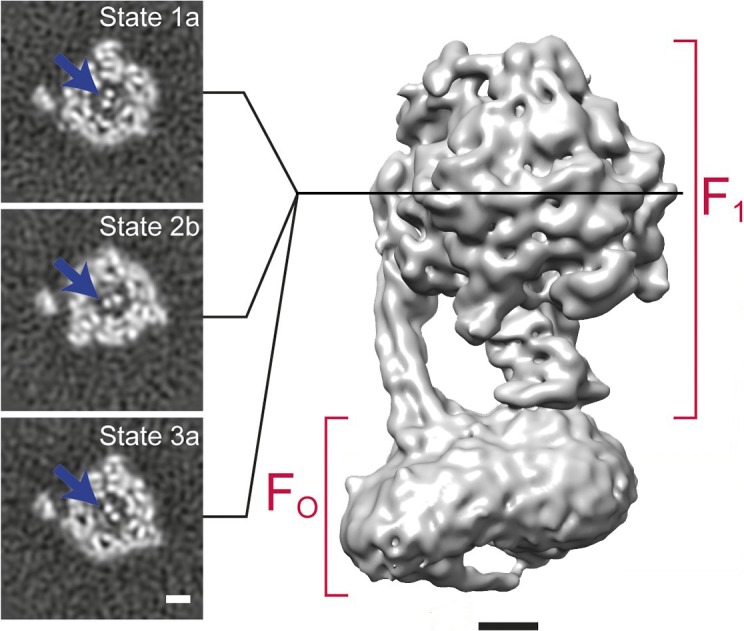
Figure 6. 3D classification of a dataset of F1FO-ATPase, revealing different conformational states (reproduced from Figure 6A and B in Zhou et al., 2015).

Sections through the F1 domain showing the γ subunit (arrows) in three different states related by 120° rotations are shown on the left. A surface rendering of the map corresponding to State 1a is shown on the right. Scale bars, 25 Å.
