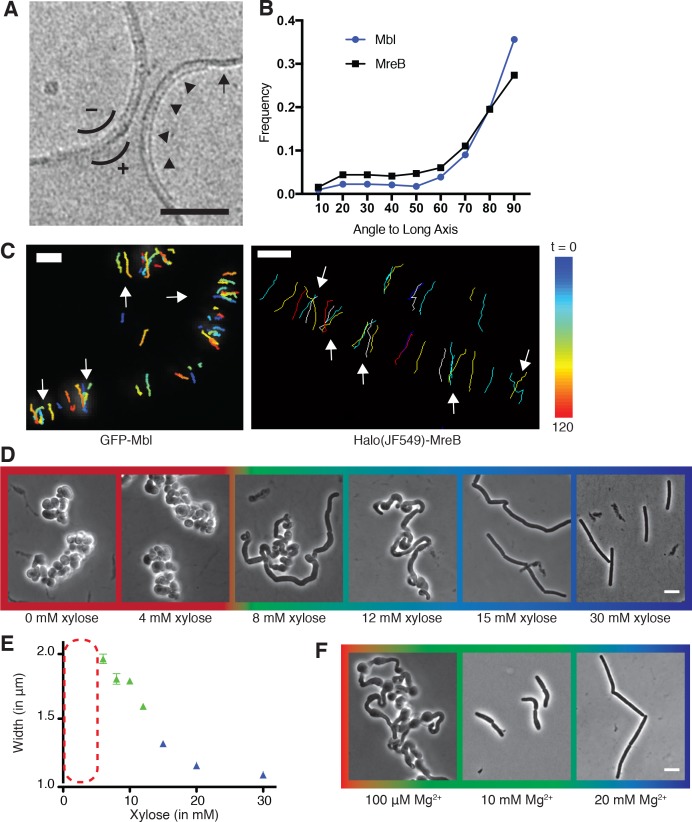
Figure 1. Curved MreB filament motions do not follow an ordered template (A–C).
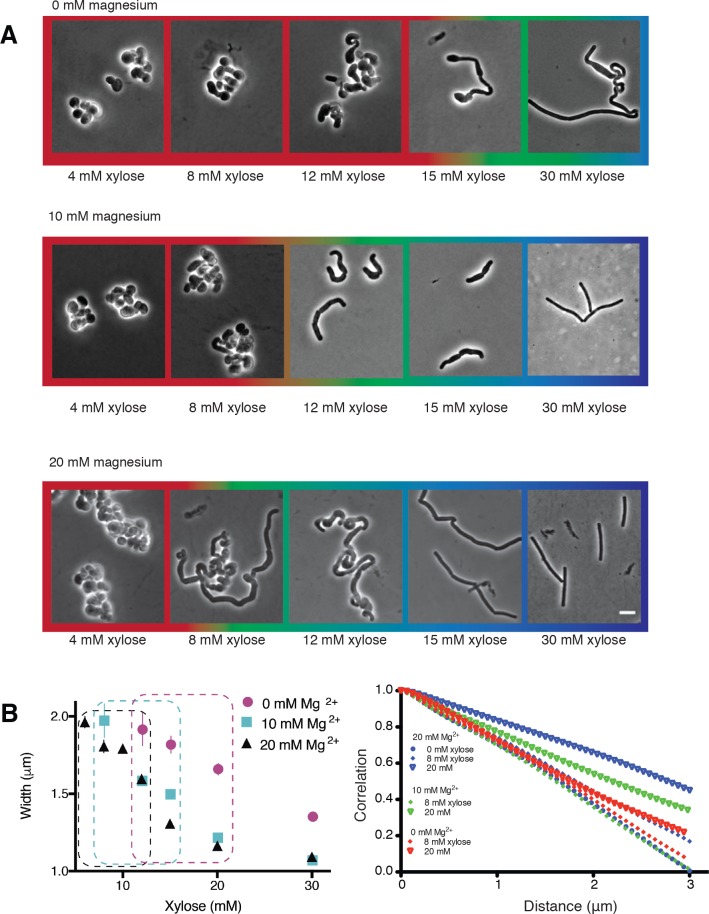
(A) The negative curvature of MreB filaments (arrowheads) aligns with the negative principal curvature of the liposome surface (arrow). Scale bar is 50 nm. (B) Angular distribution of GFP-MreB and GFP-Mbl trajectories relative to the long axis of B subtilis cells indicates that while the distributions have a mode of 90°, they are broad (Mean Deviation = 34°, n = 1041 for GFP-MreB and Mean Deviation = 26°, n = 1772 for GFP-Mbl). (C) Particle tracking of GFP-Mbl (left) and Halo-JF549-MreB (right) during 120 s (~1 rotation) indicates trajectories close in time frequently cross paths (white arrows). Scale bar is 1 μm. See corresponding Figure 1—video 1. (D) Strains with tagO under inducible control display a teichoic acid-dependent decrease in width. Strain BEG300 was grown in LB supplemented with 20 mM Mg2+. (E) Plot of cell width as a function of tagO induction in LB supplemented with 20 mM Mg2+, calculated from rod-shaped cells (error bars are Standard Error of the Mean (SEM), n = 33, 56, 104, 175, 228, 489, 119). Areas not plotted at lower xylose levels (red dashed rectangle) are regions where cells are round (no width axis). Color scheme for D-F: red indicates round cells (no width axis), blue indicates rods (measurable width axis), and green indicates intermediate regimes where both rods and round cells are observed. (F) BEG300 at an intermediate level of tagO induction (15 mM xylose) shows a Mg2+ dependent decrease in width. All scale bars are 5 μm. See also Figure 1—figure supplement 1.


