. 2018 Feb 22;7:e32471. doi: 10.7554/eLife.32471

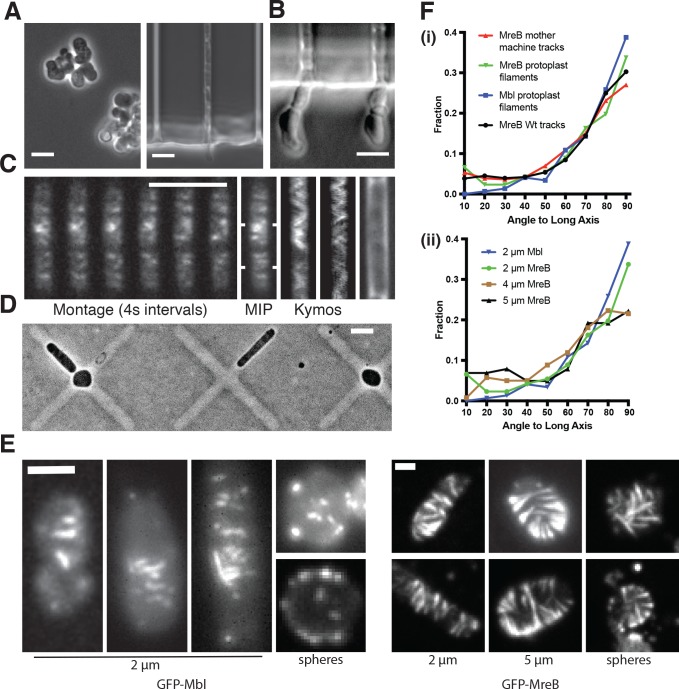
Figure 3. MreB filaments orient when rod shape is induced by external confinement.

(A) Phase contrast images of BEG300 grown in LB supplemented with 2 mM xylose and 20 mM Mg2+ in bulk culture (left) or confined into microfluidic channels of 1.5 ×1.5 μm (right). (B) Confined cells induced at 3 mM xylose in 20 mM Mg2+ progressively swell upon escaping confinement into free culture. See also Figure Figure 3—figure supplement 1A. (C) (Left) Fluorescence microscopy montage of MreB filaments moving across a confined cell of BEG300 induced at 2 mM xylose in 20 mM Mg2+. (Right) Maximal intensity projection of montage, kymographs of marked points and a phase contrast image of the cell. Scale bars for a-c = 5 μm. (D) Phase contrast images of protoplasts contained in agar crosses. Cells in the center grow to be round while cells in arms grow as elongated rods. (E) (left) Short GFP-Mbl filaments orient circumferentially in rod-shaped protoplasts (2 μm) but lack orientation in round protoplasts (spheres). (right) Long GFP-MreB filaments orient in rod-shaped protoplasts (2 μm); GFP-MreB filaments are still oriented in wider rod-shaped protoplasts (5 μm), but not to the same extent. In round protoplasts, GFP-MreB filaments are unoriented (spheres). Scale bar is 2 μm. (F) (i)The angular distribution of filaments within protoplasts (Protoplast filaments) is peaked at 90° (mean deviation = 34°, n = 147), similar to that of MreB motion in TagO-depleted, confined cells (Mother machine tracks) (mean deviation = 36°, n = 359) and MreB motion in wild-type cells (Wt. tracks) (mean deviation = 34°, n = 1041). (ii) In channels of varying widths (2, 4 and 5 μm), the orientation of GFP-MreB filaments remains circumferential, peaking at 90° but the filament angles deviate more from 90° as channel width increases (mean deviation = 34°, n = 258 at 2 μm), (mean meviation = 35°, n = 260 at 4 μm) and (Mean Deviation = 41°, n = 203 at 5 μm.). All mean deviation”values are calculated as the mean deviation from 90°.

Figure 3—source data 1. Figure 3Fi – Raw angle values from the cell midline of wildtype MreB tracks (tracks), MreB tracks in confined cells (mother machine) and MreB filaments in protoplasts (filaments), along with their associated frequency distributions.
Figure 3Fii – Raw angle values from the cell midline of GFP-MreB filaments at varying cells widths (1–2 um, 3–4 um and 4–5 um) and GFP-Mbl filaments (mbl), along with their associated frequency distributions.
DOI: 10.7554/eLife.32471.017
Figure 3—source data 2. Figure 3—figure supplement 1B – Doubling times (min) and Standard Deviation (SD) of rod-shaped and spherical cells measured by taking bulk OD600 measurements (Bulk), using single cell measurements (Single Cell), single cell measurements in cells recovering rod shape (Recovery Single), single cell measurements normalized to the cell volume (Single/Volume) and single cell measurements in spherical cells confined to rod shape (Confined).
This data was used to create Figure 3—figure supplement 1B.
DOI: 10.7554/eLife.32471.018

Figure 3.

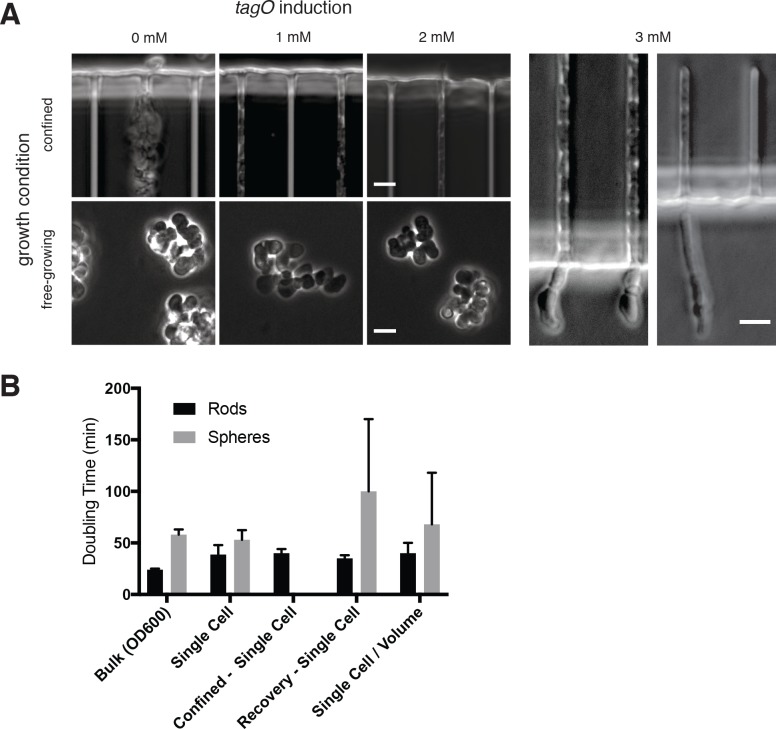
Figure 3—figure supplement 1. TagO levels and confinement.

Figure 3—figure supplement 1.

(A) Microfluidic confinement controls cell shape in cells with low TagO levels. (Left) Phase contrast images of BEG300 grown under differing teichoic acid induction levels in bulk culture or confined in chambers. (Right) Cells swell upon escaping from confinement. Swelling is visible both at initial stages of depletion, corresponding to when MreB movies were collected (left panel, cf. Figure 3C and Supplementary Movie 3), or at longer stages when cells were chained (right panel). Scale bars = 5 μm. (B) Doubling time of BEG300 in different conditions. ‘Bulk’ indicates cultures grown in liquid suspension and measured by OD600.‘Single Cell’ indicates cells were grown under agarose pads, with doubling time measured by assaying the change in cell area over time using phase contrast microscopy. ‘Confined - Single Cell’ indicates the doubling time of cell area of TagO-depleted cells confined into rod shape in microchambers as in Figure 3A and Figure 3—figure supplement 1A; ‘Recovery –Single Cell’ is the single-cell doubling time (in volume) of TagO-depleted cells during rod shape recovery in a cellASIC microfluidic device as in Figure 5B. Note that spherical cells in these recoveries show a slower doubling time with a larger standard deviation due to a subpopulation of cells dying during the experiment; ‘Single cell/Volume’ indicates the doubling time of the volume of single cells grown in a cellASIC microfluidic device. As this chamber has a fixed Z height, cell volume can be approximated from measures of the 2D area. Error bars are standard deviation.
Figure 3—video 1. Timelapse showing circumferential motion of GFP-MreB in BEG300 induced at low TagO levels (2 mM xylose) when confined into long 1.5 × 1.5 μm channels.
Download video file (321.2KB, mp4)
DOI: 10.7554/eLife.32471.019
GFP-MreB was induced with 50 μM IPTG. Frames are 2 s apart. Scale bar is 5 μm.
Figure 3—video 2. Timelapse showing GFP-MreB (top) and GFP-Mbl (bottom)in protoplasted cells showing Mbl does directionally.
Download video file (761KB, mp4)
DOI: 10.7554/eLife.32471.020
BJS18 (containing GFP-Mbl) or BEG300 (containing GFP-MreB) expressed at an ectopic site under xylose control) were induced with 30 mM xylose. Cells were then protoplasted in SMM and grown in molds as detailed in methods. Frames are 1 s apart. Scale bar is 5 μm. Movie was gamma-adjusted,γ = 0.8.