. 2018 Feb 22;7:e32471. doi: 10.7554/eLife.32471

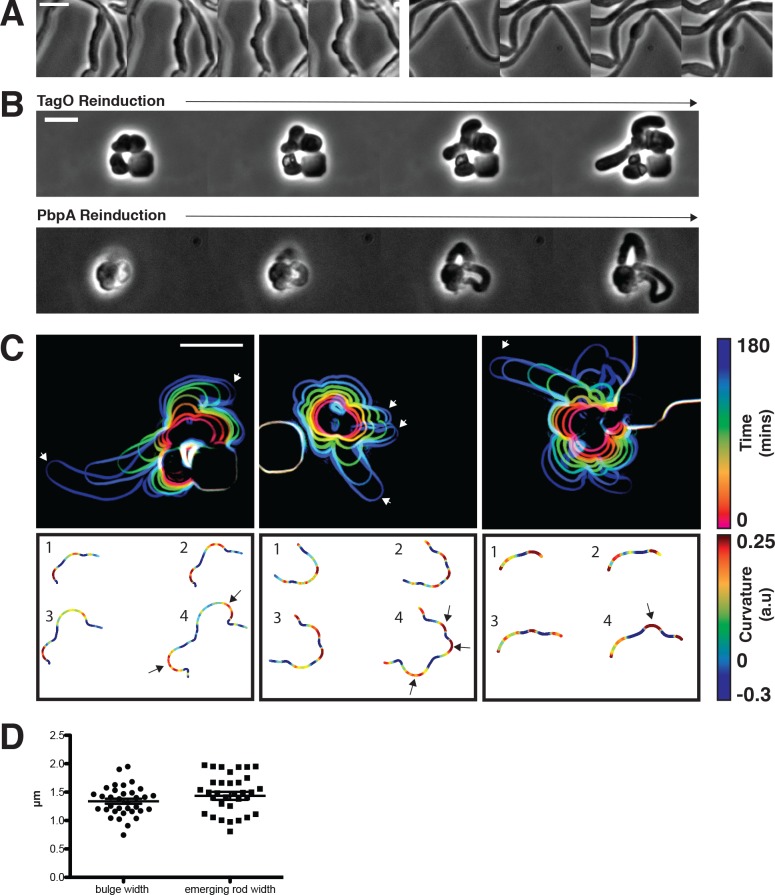
Figure 5. Sphere to rod transitions occur locally, then rapidly propagate.

(A) Loss of rod shape proceeds continuously and without reversals, as shown by BEG300 cells grown in 12 mM xylose, shifted from 1 mM Mg2+ to 100 μM Mg2+ on a pad. Frames are 5 min apart. (B) Increases in expression of tagO or pbpA from depleted spherical cells causes cells to emit rapidly elongating rods from discrete points. (Top) BEG300 cells in 20 mM Mg2+ were grown in 0 mM xylose for 4 hr, then transferred to a microfluidic chamber and grown in 0 mM xylose and 20 mM Mg2+ for 1 hr. Following this, tagO expression was induced with 30 mM xylose at the first frame. (Bottom) BRB785 cells in 20 mM Mg2+ were depleted of Pbp2a by growth in 0 mM IPTG for 4 hr. At the start of the frames, they were transferred to an agar pad containing 1 mM IPTG to induce pbpA expression. Frames are 30 min apart. (C) Plots of cell contours as cells recover from TagO depletion: (top) cell outlines are colored in time red to blue (0–180 min). White arrows indicate emerging rods; (bottom) heat maps of curvature show that rods emerge from small outward bulges (red) flanked by inward curvatures (blue). Black arrows indicate points where emerging rods form. (D) The width of initial bulges and the rods that emerge from them are highly similar, indicating the initial deformations may set the starting width of the rods. Error bars are SEM, n = 33. All scale bars are 5 μm.

Figure 5—source data 1. Figure 5D – Widths of the initial outward bulges (bulge) and eventual emerging rods (emerging rod) during multiple sphere to rod transitions by the re-induction of tagO.
DOI: 10.7554/eLife.32471.026
Figure 5—source data 2. Figure 5—figure supplement 1C – 1/doubling time measured at various points in the xylose, magnesium phase space.
This data was used to create Figure S5C.
DOI: 10.7554/eLife.32471.027

Figure 5.

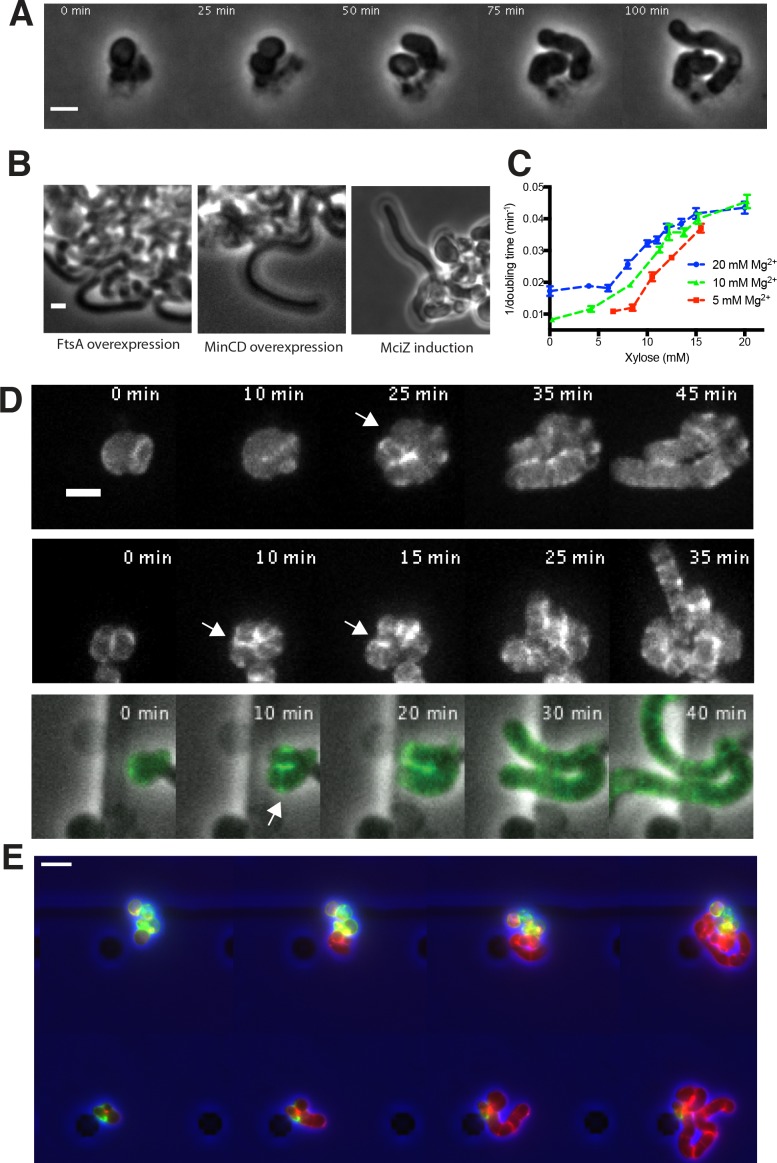
Figure 5—figure supplement 1. Growth of rod-shaped and spherical cells measured by doubling times, and rod shape recovery.

Figure 5—figure supplement 1.

(A) A montage of a rod shape recovery occurring after a division that produced an ovoid, near rod-shaped cell that subsequently elongated as a rod. This example taken from an experiment with BRB785, where Pbp2a was first depleted (in a pbpH null) to make round cells, then Pbp2a was reinduced with 1 mM IPTG. See also bottom panel of Figure 5—figure supplement 1D. (B) Rod shape recovery occurs in the absence of cell division and FtsZ filaments. Inhibition of FtsZ filaments was conducted by three means: FtsA overexpression (bAB388, grown with 1 mM IPTG and 60 mM xylose), MinCD overexpression (bAB327 grown with 1 mM IPTG and 60 mM xylose), and MciZ induction (bAB343 grown in 1 mM IPTG and 30 mM xylose). In all cases, cells recovered rod shape. (C) Rate of doubling (1/doubling time), calculated from OD600, increases with increasing levels of TagO as round cells become more rod-like. Increasing Mg2+ causes these curves to shift leftward, as Mg2+ stabilizes rod shape in combination with WTAs (see Figure 1—figure supplement 1). Error bars are SEM. (D) MreB localizes in a ring-like structure (white arrows) at the neck of emerging bulges, immediately prior to rod shape formation. BEG300, containing GFP-MreB was depleted of TagO by growing in bulk culture in media lacking xylose. Cells were then loaded into a cellASIC device and grown for 2 hr in the same media with 1 mM IPTG added to induce GFP-MreB expression. At the start of imaging, the media was switched to 30 mM xylose to induce TagO expression, and Z-stacks of GFP MreB were taken using a spinning disk confocal every 5 min. Shown is the maximal intensity projection of entire cell. (E) Pulse chase labeling with FDAAs during TagO recoveries indicates that while emerging rods are composed of new cell wall, both spheres and rods incorporate new cell wall material. BCW82 was grown in a microfluidic chamber with 0 mM xylose, 20 mM Mg2+, and 3 μM HADA (green). Prior to imaging the medium was switched to 30 mM xylose (to induce TagO expression), 20 mM Mg2+ and 3 μM cy3B-ADA (red, to visualize new cell wall incorporation). Cell outline (from phase) is shown in blue. Scale bar is 5 μm; frames 30 min apart.
Figure 5—video 1. (top and middle) Timelapses showing the local recovery of rod shape upon TagO reinduction from depleted cells.
Download video file (567.9KB, mp4)
DOI: 10.7554/eLife.32471.028
Note the relatively fast growth of rods compared to parent spheres. BEG300 was grown in media lacking xylose, then either loaded into a cellASIC device (top row) or placed under an agar pad (middle row). Both rows were shifted to 30 mM xylose to induce rod-shape recovery, prior to image acquisition. Frames are 10 min apart. Scale bar is 5 μm. (bottom) Timelapse showing the local recovery of rod shape upon Pbp2a reinduction from cells depleted of Pbp2a/PbpH. BRB785 was grown media lacking IPTG for 4.5 hr, then placed on a pad with 1 mM IPTG before the start of imaging. Frames are 5 min apart. Scale bar is 5 μm.
Figure 5—video 2. Timelapse showing the loss and recovery of rod shape in cells with intermediate TagO levels, induced by removal and subsequent readdition of MgCl2.
Download video file (436.1KB, mp4)
DOI: 10.7554/eLife.32471.029
BCW51 was grown in LB supplemented with 8 mM xylose and 20 mM MgCl2, then loaded into a cellASIC chamber, and grown in the same media for 30 min. At the start of the video the media is switched to contain 0 mM MgCl2, causing the cells to lose rod shape. At 4:00:00 the media is switched to contain 20 mM MgCl2 where the cells revert back into rod-shaped cells. Frames are 20 min apart. Scale bar is 1 μm.