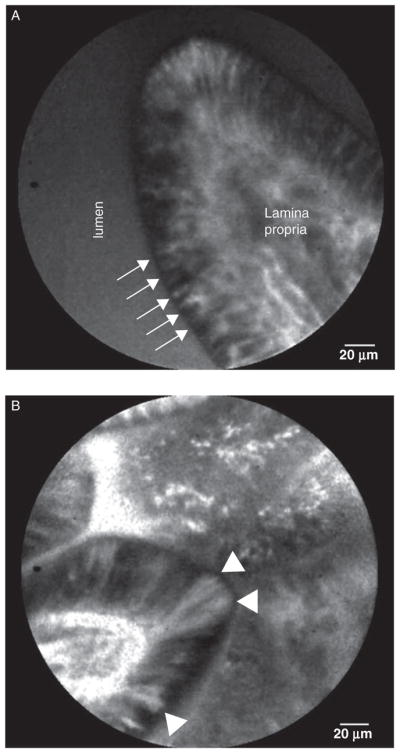
FIGURE 1.

Representative images of villi used for epithelial gap density derivation. A, normal villous with no epithelial gaps seen. Arrows indicate individual intestinal epithelial cells. B, abnormal villous with several epithelial gaps present, arrow heads indicate epithelial gaps.
