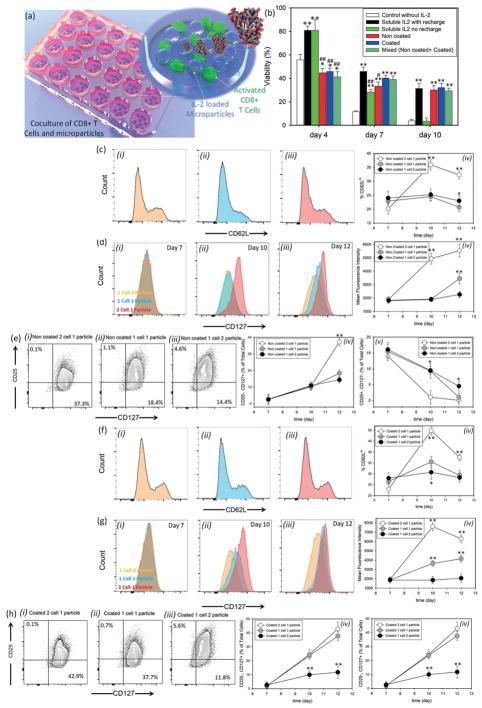
Figure 2.
Role of interleukin-2 presentation on differentiation of cytotoxic T-cells. a) Schematic representation of CD8+ T-cells and microparticles coculture. b) Effects of IL-2 release on viability of CD8+ T-cells. All data are presented as average ± SD. The results were analyzed using unpaired t-tests. For all of the tests, the threshold was set to p < 0.05 for “statistically significant” and p < 0.01 was for “statistically very significant.” The thresholds *p < 0.05 and **p < 0.01 were obtained between each group and the control group without IL-2 treatment (negative control). On the other hand, #p < 0.05 and ##p < 0.01 are between each treatment and the cells treated by IL-2, with recharge (positive control). c) Kinetics of CD62L expression when purified naïve CD8+ T-cells were stained with antibodies against CD62L ex vivo and after priming for 2 d with anti-CD3 + anti-CD28 (day 2). Histograms are representative of day 12 marker expression on cells after treatment with one noncoated particle per two cells i), one particle per cell ii), and two particles per cell iii) as IL-2 releasing agents. iv) The MFI of CD62L expression during the treatment. d) Regulation of IL-7Ra (CD127) re-expression after priming in three different ratios of cell to particle at days 7 i), 10 ii), and 12 iii) and MFI of cells in these conditions over time iv). e) Flow cytometric analysis of IL-2Ra and IL-7Ra coexpression when treated with noncoated microparticles at particle: cell ratios of i) 1:2, ii) 1:1, and iii) 2:1. Percentage of cells that fall in the category of memory T-cells (CD 25-, CD127+) iv), or effector cells (CD25+, CD127−) v) in three different IL-2 concentrations over time. f) Kinetics of CD62L expression after incubation of activated CD8+ T-cells with coated microparticles stained with antibodies against CD62L ex vivo at particle: cell ratios of 1:2 i), 1:1 ii), and 2:1 iii). Histograms are representative of day 12 marker expression. iv) The MFI of CD62L staining is shown. g) The regulation of IL-7Ra (CD127) re-expression after priming in three different ratios of cells to coated particles at days 7 i), 10 ii), and 12 iii) and MFI of cells in these conditions over time iv). h) Analysis of IL-2Ra and IL-7Ra coexpression when treated with noncoated microparticles at three different ratios of i) 1:2, ii) 1:1, and iii) 2:1 to the cells. Percentage of cells that fall in the category of memory T-cells (CD 25−, CD127+) iv), or effector cells (CD25+, CD127−) v) in three different IL-2 concentrations over time is represented. In (c–h), the presented data are expressed as average ± SD. The results were analyzed using unpaired t-tests.

