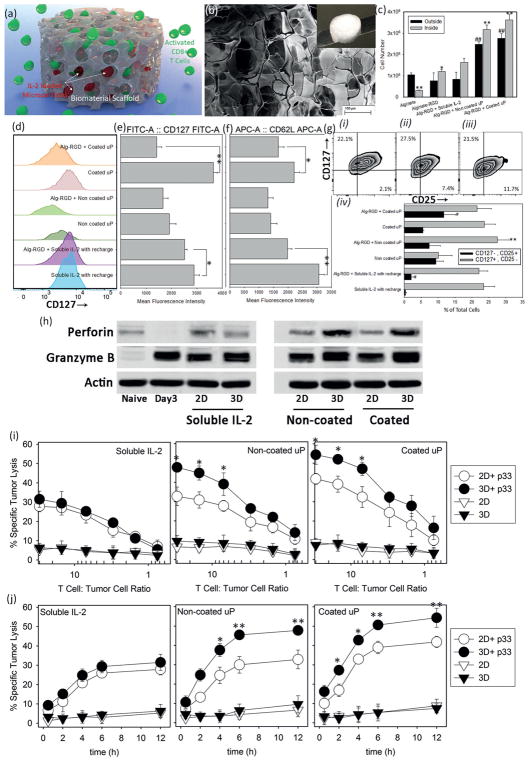
Figure 5.
Performance boost from encapsulation in scaffold. a) Schematic representation of scaffold approach to deliver pre-activated T-cells and IL-2 loaded microparticles. b) Electron microscopy image of the prepared alginate-RGD scaffold. Scale bar: 100 μm; Inset: Macroscopic image of a freeze-dried scaffold. c) Number of cells inside and outside the scaffolds 10 d after incorporation of T-cells into the scaffold and in absence or presence of IL-2 (soluble administration or released by microparticles). The presented data are expressed as average ± SD. The results were statistically analyzed using unpaired t-tests. *p < 0.05 and **p < 0.01 are between numbers of cells inside each scaffold and the control alginate-RGD scaffold with soluble IL-2 (positive control). #p < 0.05 and ##p < 0.01 are between number of cells outside each scaffold and the control alginate-RGD scaffold with soluble IL-2 (positive control). d) Regulation of IL-7Ra (CD127) re-expression after 10 d of treatment in presence or absence of scaffold and MFI of cells in these conditions e). f) The quantification (MFI) of CD62L expression after 10 d of treatment. *p < 0.05 and **p < 0.01 are between the samples treated with and without using the alginate-RGD scaffold. g) Flow cytometric analysis of co-expression of IL-2Ra and IL-7Ra for scaffold-based treatment with soluble IL-2 i), noncoated ii), and coated iii) microparticles at constant ratio of one particle per cell. Quantitative evaluation of the percentage of cells that fall in the category of memory T-cells (CD 25−, CD127 +) versus effector cells (CD25+, CD127−) after 10 d of treatment in different conditions iv). **p < 0.01 is between the samples treated with and without using the alginate-RGD scaffold; CD25+, CD127− group. #p < 0.05 is between the samples treated with and without using the alginate-RGD scaffold; CD 25−, CD127+ group at day 10. h) CD8+ T-cells were MACS-purified, FACS-sorted, and cocultured with soluble IL-2 or IL-2 loaded microparticles in 2D or 3D cultures for 10 d. Western blot analysis show levels of perforin and granzyme B. β-actin was used as loading control. i) Chromium (51Cr) release assays comparing antigen (p33)-specific (circles) and nonspecific (triangle) cytotoxicity of treated T-cells with different methods in 2D (empty circles) versus 3D (filled circles) cultures after 12 h in the indicated T-cells to tumor cells ratios. j) Kinetics of cytotoxic activity of p33-specific T-cells after treatment with soluble IL-2, noncoated, and coated IL-2-loaded microparticles in 2D (empty circles) and in 3D alginate-RGD scaffold (filled circles). Cytotoxic activity of spleen-derived, in vitro treated, CD8+ T-cells was analyzed using chromium assay. Specific tumor lysis was determined at the indicated time points (30 min, 2, 4, 6, and 12 h) of incubation. Cytotoxic activity was examined at four different ratios (30:1, 7:1, 3:1, and 0.75:1) of treated T-cells to tumor cells. The data are presented as average ± SD of five independent samples. The presented data are expressed as average ± SD. The results are analyzed using unpaired t-tests. In (h) and (j), p33-treated and nontreated T-cells are significantly different (p < 0.001).

