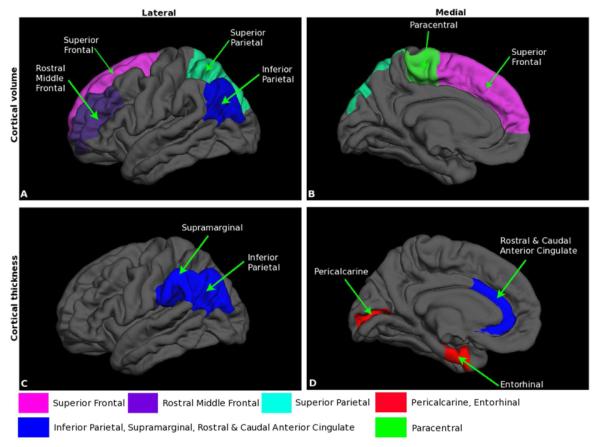
Figure 1.

Cortical volume and thickness differences between adolescents with d-TGA and control groups. A, Lateral and B, medial views of the brain showing the cortical locations of decreased volume in d-TGA as compared with control adolescents C, Lateral and D, medial views of the brain showing the locations at which cortical thickness is greater in d-TGA as compared with control groups, as well as locations in which cortical thickness is lower in d-TGA as compared with control groups.
