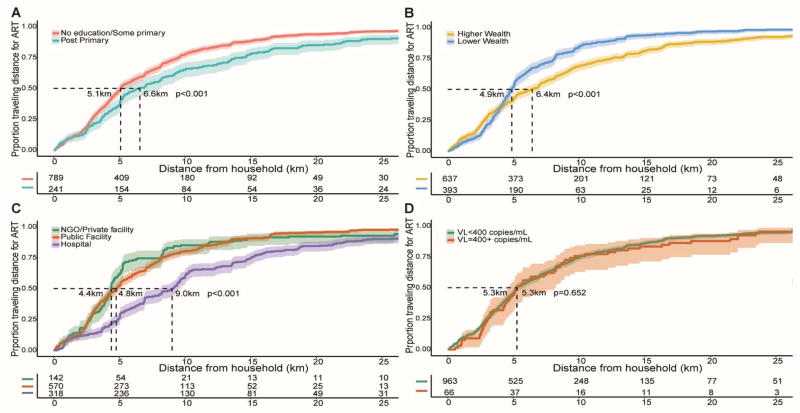
Figure 2. Distance traveled to access HIV treatment, in the Rakai Community Cohort Study.
Figure shows the cumulative proportion who traveled particular distances for ART treatment with 95% CI intervals shown as shaded areas. Distances are from their household to their treatment facility in kilometers. (A) Distance to treatment facility by traveled by education level; (B) Distance to treatment facility by traveled by wealth level; (C) Distance to treatment facility by traveled by health facility type; (D) Distance to treatment facility by traveled by viral load.

