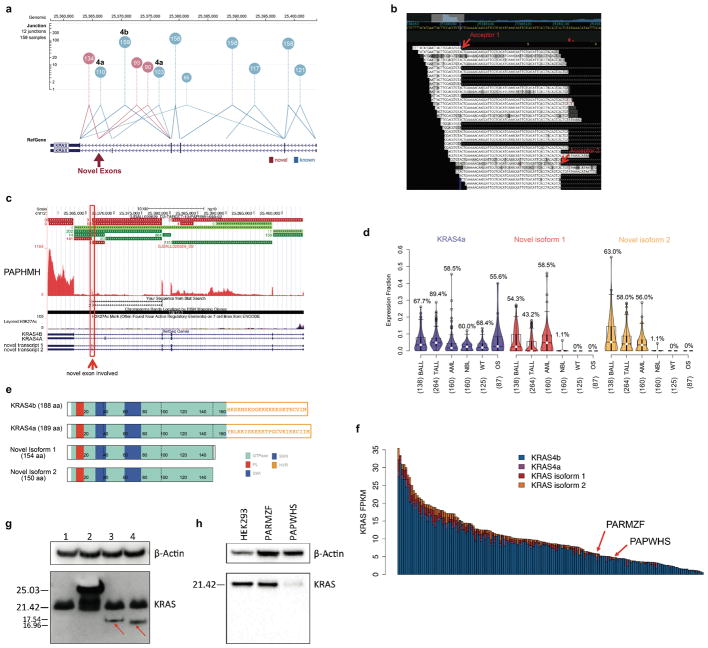
Extended Data Figure 6. Expression of novel KRAS isoforms.
a, KRAS RNA-seq reads spanning splice junction in AML samples. Each junction is shown as a circle labeled by counts of detected samples, with lines connecting the splice sites. The circle’s y-axis position represents the median supporting read count. Canonical junctions are colored blue and novel junctions in red. b, RNA-seq reads in the last intron of KRAS illustrate the two novel exons detected in a B-ALL sample (PAPHMH). Novel splicing acceptor sites are indicated by red arrows. c, Junction reads for KRAS in the same B-ALL sample. Canonical KRAS exons are shown as green horizontal bars while novel exons are shown in red (top panel) and the RNA-seq coverage at the KRAS gene locus is shown below. The two novel exons are indicated with red arrows. d, Expression of two novel isoforms with KRAS4a as a control. Percentage of samples expressing these isoforms are indicated. Median, first and third quartiles are indicated by horizontal bars. Sample sizes are indicated in parenthesis. e, Protein domains for KRAS4a, KRAS4b and two novel isoforms. f, KRAS expression (FPKM) in AML samples analyzed in this study, categorized by the four isoforms. g, Western blot for KRAS in 293T cells. Cells were transfected with empty vector (lane 1), tagged wild type KRAS (lane 2), novel isoform 1 (lane 3) and 2 (lane 4). Protein products of the two novel KRAS isoforms were indicated by red arrow. h, Western blot for KRAS in two patient tumour samples (PARMZF and PAPWHS). Protein products of the two novel isoforms were not detected in these two samples. For panels g and h, the experiments were performed in duplicate and similar results were observed (see Supplementary Figure 1 for gel source data).

