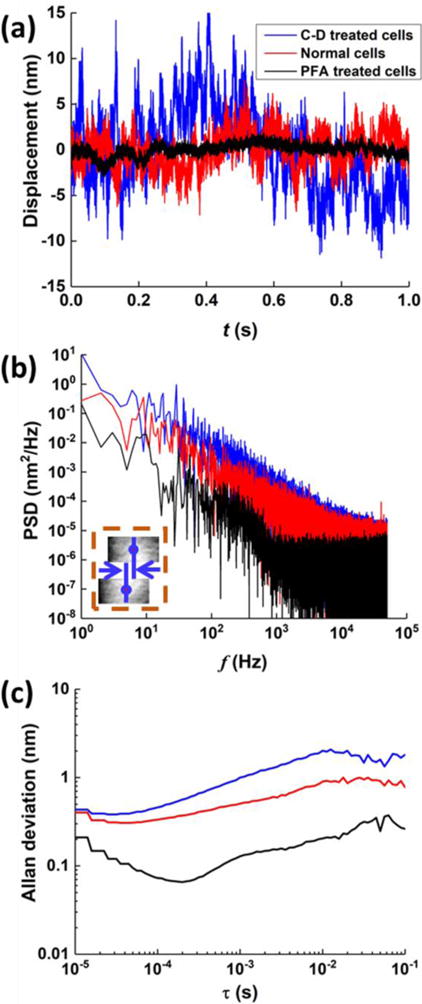
Fig. 3.

Spontaneous membrane fluctuations dynamics of HEK 293 cells upon different treatment on cellular cytoskeleton structures. Typical time traces (a), PSDs (b) and Allan deviation (c) of membrane fluctuations without (red curves), with cytochalasin D (blue curves), and paraformaldehyde (PFA) (black curves) treatment. The insets in (b) show the differential measurement scheme.
