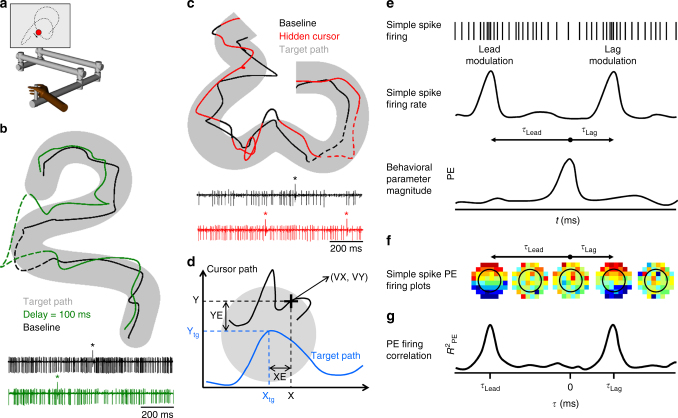
Fig. 1.
Experimental setup, example Purkinje cell recordings during visual feedback manipulations, and analysis steps. a Monkeys use a manipulandum to track a circular target (red circle) moving pseudo-randomly (target trajectory depicted by dotted line) on a computer screen. Image modified from Streng et al.21. b Cursor path in baseline (black trace) and delay conditions (green trace) while the monkey tracked the target moving on the same trajectory (gray area). Example Purkinje cell activity recorded during delay (green) and baseline (black) conditions during the 1 s dashed segments of the trajectories. Complex spikes marked by ‘*’. c Cursor path in baseline (black trace) and hidden (red trace) conditions while the monkey tracked the target moving on the same trajectory (gray area). In the hidden condition, the animal does not see the cursor when it is inside the target (red portion of the cursor movement). The cursor is visible only when it is outside the target (black portion of the cursor movement). Example Purkinje cell activity recorded during baseline (black) and hidden (red) conditions during the 1 s dashed segments of the trajectories. d Behavioral parameters analyzed. Target path (gray circle) is depicted by the blue trace. Hand movement is mapped onto the cursor movement (black trace). Movement kinematics are described by position (X, Y) and the velocity vector (VX, VY). Position error (XE, YE) is the difference between cursor position (X, Y) and target center (Xtg, Ytg). e Illustration of the analysis steps. Cartoon of simple spike train (top panel) is transformed to a mean-subtracted continuous firing rate (middle panel) and correlated with the behavior parameters (bottom panel). Arrows in the middle panel illustrate the lead and lag relations (τ) between SS modulation and behavior. PE: position error. f Example of mean-subtracted SS firing rate across all trials, binned and averaged in 8 × 8 partitions in relation to behavior (PE in this illustration) at both lead and lag τ-values. Red colors indicate higher discharge rates. g Temporal linear regression analysis results in R2 as a function of τ that quantifies the relation between SS activity and behavior

