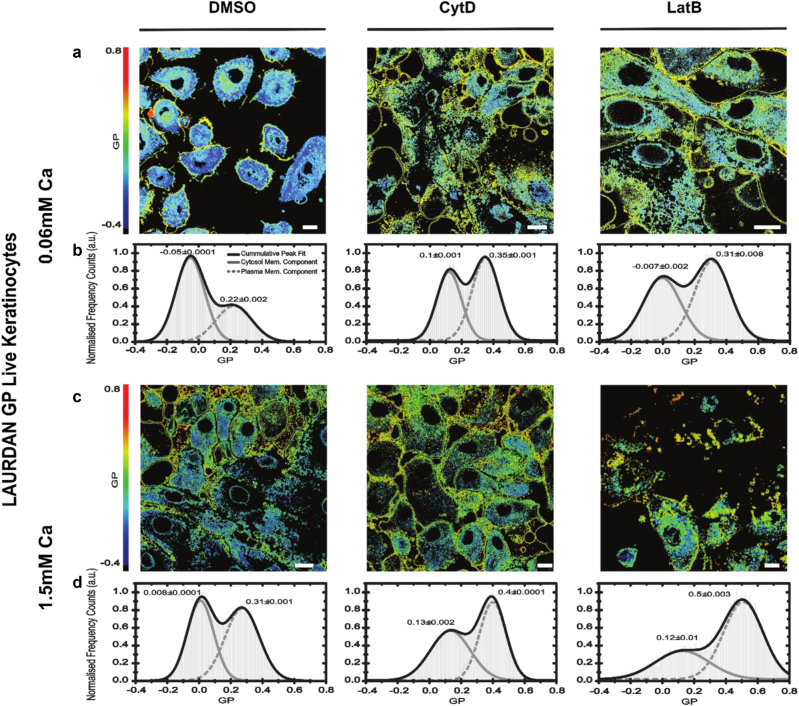
Fig. 7. Actin disruption leads to accelerated cornification.
a–d GP images (a, c) and histograms of GP values over all image pixels generated from 2D scanning confocal images of live NHEKs labeled with the polarity-sensitive lipid analog dye Laurdan; large GP values indicate increased stiffness of the cellular membranes. Conditions without any treatment (left panels) and with cytochalasin D (CytD, middle panels) and latrunculin B (LatB, right panels) treatment after treatment at low [Ca2+] = 0.6 mM (a, b) and high [Ca2+] = 1.5 mM (c, d) calcium levels. Scale bar 10 µm. Data are representative of three separate experiments, at least n = 15 cells per condition. The left (lower values) and right (higher values) peaks in the GP histograms indicate the cytosolic and membrane components, respectively, highlighting an increase in membrane stiffness for larger calcium levels, i.e., increased differentiation, and after actin disruption

