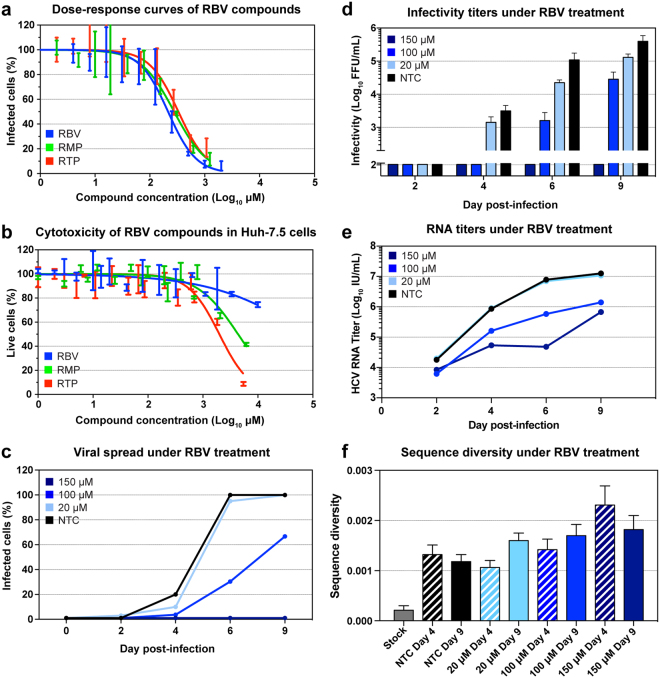
Figure 1.
Ribavirin treatment of Huh7.5 cells infected with HCV J6/JFH1. (a) Dose-response curves of RBV, RMP and RTP in J6/JFH1 infected cells estimated by immunostaining of NS5A, obtained with triplicate determinations for each drug dilution. Data was normalized to non-treated controls, and curve fitting was thus performed with 0%-100% constraints. Error bars indicate standard deviation (SD). (b) Cell viability assay performed on Huh7.5 cells treated with RBV, RMP, and RTP. All data points were determined in triplicate; error bars indicate SD. (c–f) Panels representing data from one of two sets of independent experiments (for the second set of experiments see Supplementary Fig. 1). (c) Infection spread of J6/JFH1 virus estimated by immunostaining of NS5A in treated and non-treated samples. Data points represent the average of 1–3 determinations. (d) Viral infectivity of filtered supernatants obtained from treated and non-treated samples, data points represent the average of at least 3 determinations, error bars represent SD. (e) HCV RNA titers of viruses recovered from supernatants of treated and non-treated samples; data points represent averages of at least 2 measurements. (f) Nucleotide diversity of genomes extracted from stock virus and supernatants from RBV treated and non-treated samples, calculated as average p-distance. This distance is the average proportion of different nucleotides between sequence pairs. Sample sizes for each sample are found in Table 1. Banded bars indicate samples from day 4. Error bars represent standard deviations (SD).

