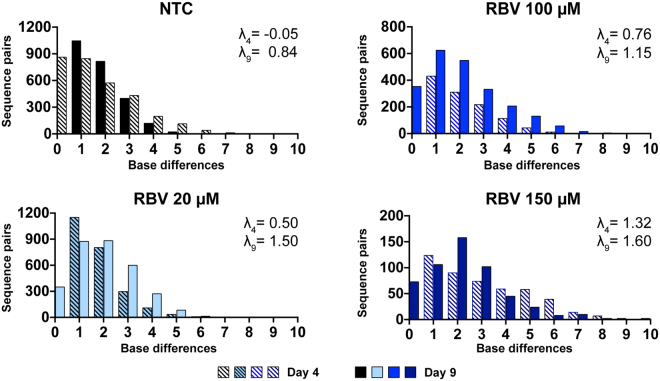
Figure 2.
Hamming distances in HCV sequences obtained from supernatants of RBV treated and non-treated J6/JFH1 cell cultures. Graphs show the distribution of number of base differences per sequence pairs, at day 4 (banded bars) and day 9 (solid bars) for each sample. Colors represent different RBV dilutions matched to the values in Fig. 1. The shown lambda values were calculated by fitting the datasets to a Poisson distribution. Sample sizes for each sample are found in Table 1.

