Figure 2.
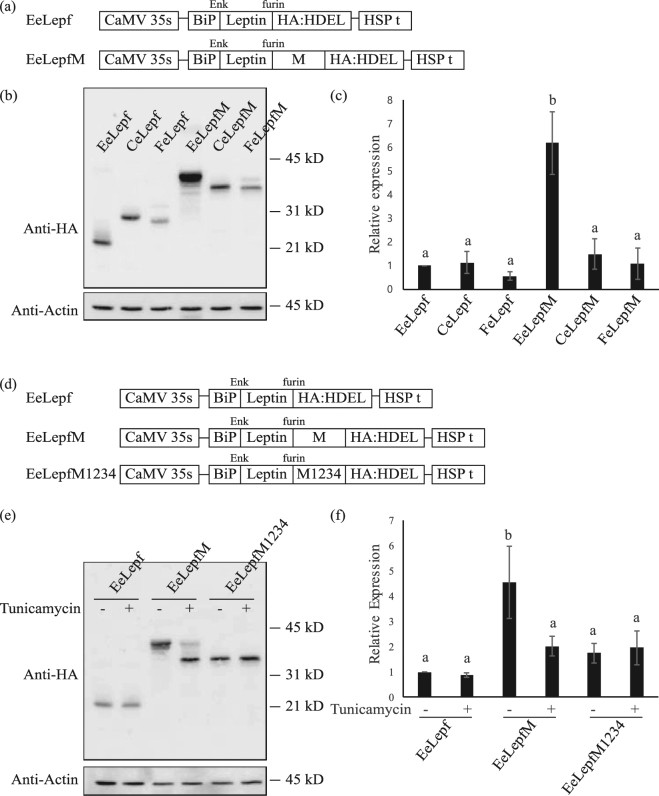
Fusion of the M domain increases the expression levels of recombinant protein. (a) Schematic representation of the constructs. All target sequences were expressed under the control of the cauliflower mosaic virus (CaMV) 35 S promoter and heat shock protein (HSP) terminator. ER-targeted proteins contain the leader sequence of BiP. Recombinant proteins targeted to the chloroplast or mitochondria contain the transit peptide of Cab or the presequence of the F1-ATPase gamma subunit, respectively. Enk, enterokinase. (b) Western blot analysis of various recombinant proteins. Protein extracts from protoplasts transformed with the indicated constructs were analyzed by western blotting using anti-HA antibody. Actin (detected using anti-actin antibody) was used as a loading control. EeLepf and EeLepfM are ER-targeted proteins, CeLepf and CeLepfM are chloroplast-targeted proteins, and FeLepf and FeLepfM are mitochondria-targeted proteins. (c) Quantification of protein levels. The intensity of protein bands from Fig. 2(b) was quantified using the software provided with the LAS4000 image analyzer; values relative to that of ER-targeted EeLepf are shown. Error bars, standard deviation (n = 3). Means with different letters indicate significant difference (Tukey’s test P < 0.05). (d) Schematic representation of unglycosylated mutant protein M1234. Four Asn residues were substituted with Gln residues as indicated. (e) Analysis of N-glycosylation. Protoplasts transformed with the indicated constructs were incubated for 24 h with or without tunicamycin (10 μg/mL). Protein extracts from transformed protoplasts were analyzed by western blotting using anti-HA antibody. (f) Quantification of protein levels. To quantify protein levels, the signal intensity of each band in Fig. 2(e) was measured using the software provided with the LAS4000 system; values relative to that of tunicamycin-untreated EeLepf (EeLepf -) are shown. Three independent experiments were performed. Error bar, standard deviation (n = 3). Means with different letters indicate significant difference (Tukey’s test P < 0.05).

