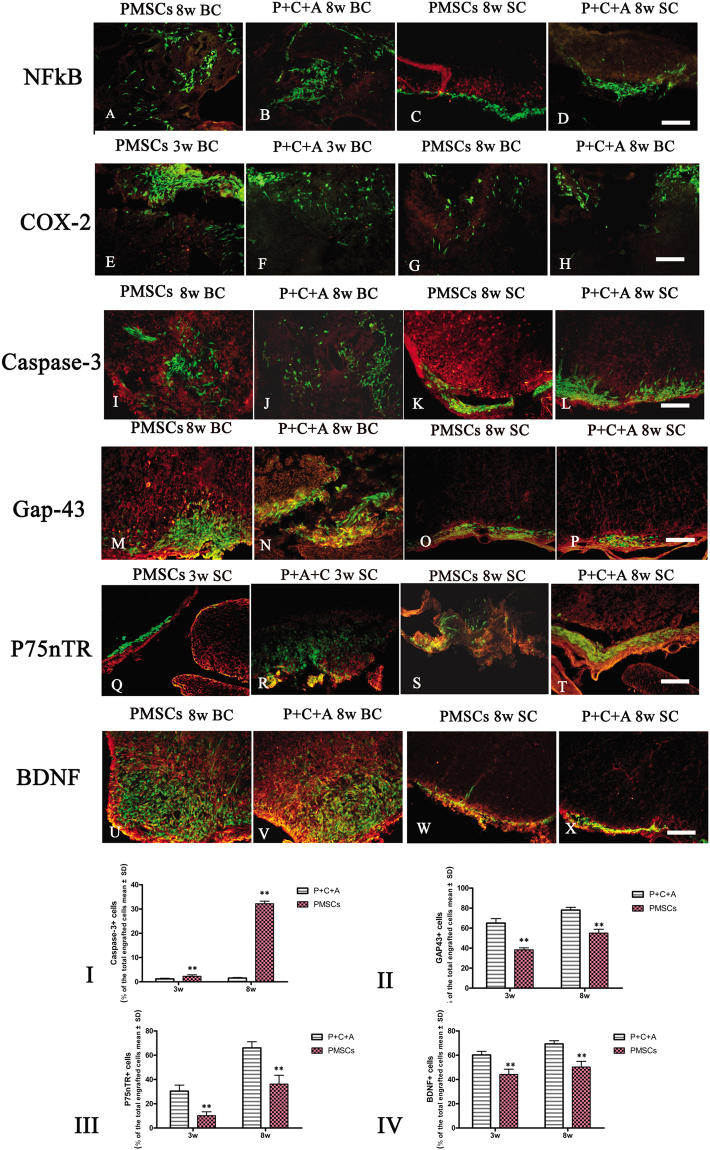
Figure 10.
Immunofluorescence staining of PMSC grafts (green) in brain cortex and spinal cord specimens for NF-κB (red, A–D), COX-2 (red, E–H), caspase-3 (red, I–L), GAP-43 (red, M–P), p75NTR (red, Q–T), and BDNF (red, U–X) at 3 and 8 weeks pi. SC denotes transverse sections through the anterior horn of the lumbar spine, and BC denotes coronal sections of the motor cortex. Scale bars, 100 μm. (I–IV) Percentages of cells stained positively for caspase-3 (I), GAP-43 (II), p75NTR (III), and BDNF (IV) among all engrafted PMSCs. n = 5, **P < 0.01 vs. P + C + A. (I) ES = 2.63, P = 0.0003 at 3 weeks pi; ES = 24.77, P < 0.0001 at 8 weeks pi. (II) ES = 1.09, P < 0.0001 at 3 weeks pi; ES = 1.05, P < 0.0001 at 8 weeks pi. (III) ES = 0.6, P < 0.0001 at 3 weeks pi; ES = 0.37, P < 0.0001 at 8 weeks pi. (IV) ES = 0.57, P < 0.0001 at 3 weeks pi; ES = 0.67, P < 0.0001 at 8 weeks pi.

